Taxes on sugar-sweetened beverages (SSB) have now been implemented in at least four cities, San Francisco, Seattle, Oakland, and the largest, Philadelphia. Much like the tax on tobacco, the purported reason was to reduce a modifiable health risk, obesity, especially among “the children.” As it is too early to see significant beneficial health impacts, if they ever do develop, this new paper, from the National Bureau of Economic Research, looks at SSB consumption.
It differs from previous efforts in two significant ways. First, it looks at specific household sale data, not aggregates. The individual household sales data comes from a marketing database [1], that captures purchases from sales receipts. Second, the researchers consider two matched control households. A local family, in an untaxed area immediately surrounding the taxed geographies, presumably experiencing the same media and economic conditions, but subject to “spillover” effects – e.g., traveling into a taxed area and having to pay more for their soda. And a more distant, national household cohort, eliminating that spillover effect and with a different media landscape.
All the households, both treatment, and controls, had children; the restriction made because “children are at elevated risk of health effects from consuming SSBs.” Safeguarding our children from obesity is a frequent reason given for the imposition of the tax. Households were matched by “income, race/ethnicity, household size, and education.” But matched is similar, not identical. For the local controls, fewer primary shoppers were or had been married. For the national controls, primary shoppers were older, more Caucasian, and more likely to be or have been married.
The dataset consisted of the sum of beverages purchased monthly for the six months before and after the implementation of the SSB tax. There were 483 households in taxed cities, 480 matched local, untaxed households, and 484 matched urban households taken from the national sample.
- In the six months before tax implementation, households in the taxed cities purchased more SSB than either control. 468 ounces vs. 429 in local markets and 436 ounces nationally. [2] While the baseline amounts varied, there was no evidence of increasing or decreasing consumption during the six months run-up between any of the groups.
- An increase in the beverage tax rate of 1 cent/ounce resulting in a 53-ounce (12.2%) reduction in household purchases when the four cities were aggregated.
- Most of the reduction in this aggregated data was in Philadelphia, which instituted a 1.5 cent/ounce tax, “implying a decline in monthly purchases of 126.1 ounces or 27.7%” Philadelphia was the only city to show a persistent decline and accounted for all the “benefit.”
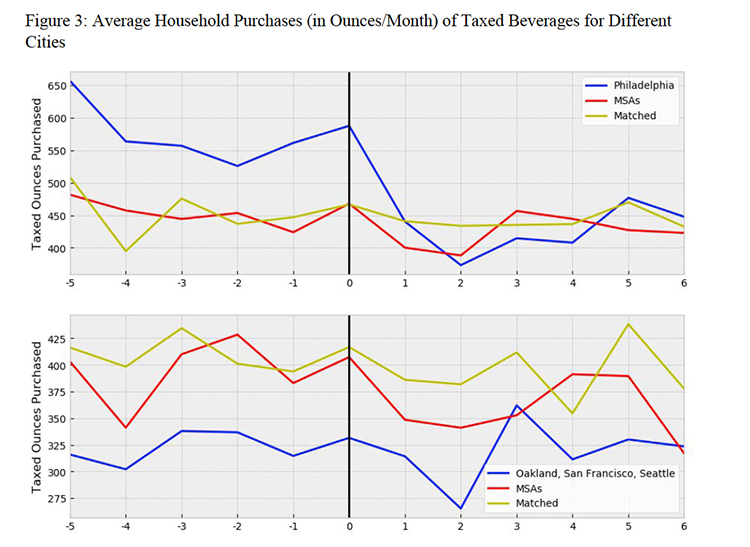
- Households in the taxed areas made fewer trips to purchase and purchased fewer SSBs, initially. Over time, purchases returned to the pre-tax baseline in a recognizable pattern - a 75-ounce reduction in the first month, a more significant decrease in month two, and then a rebound. The local market controls exhibited a similar pattern, but there were no changes purchases by the national controls.
I am not going to bother pointing out which of these numbers is statistically significant - taxing a product, increases cost, and reduces demand. But if the intended purpose was to reduce obesity, improve population health, we might better consider the reduction in calories. For caloric intake, what did the tax accomplish?
“A back-of-the-envelope calculation suggests that this effect translates into a reduction in consumption of 21 calories per day per household, which is a reduction of 5 calories per day per household member and a reduction in weight of 0.5 pounds per household member after roughly three years.” [3]
Even with the most plausible highest reduction, the value at the top of the confidence intervals, the reduction in calories “indicates a small change in steady-state weight.” Based on the best real-world data we have, taxation of SSBs is insufficient to prompt a clinically significant weight loss.
Taxes rarely disappear; they may increase or occasionally decrease. It is doubtful that an SSB tax is going to end just because it has not shown any health benefit. Money is money to cash strapped municipalities, so we can expect to see more taxation of sinful beverages in our future. To be honest, perhaps we should stop arguing that the tax will benefit our health or that of our children, the tax decreases demand, but it has little impact on reducing overall caloric intake. Moving forward, could we at least insist that the monies collected go to paying for healthcare in these communities? Or will we again witness what happened with the “Tobacco Settlement” the money went into the general funds for the politicians to spend as they wish, with only a tiny fraction going to smoking cessation?
[1] InfoScout
[2] The report expresses purchases in ounces, and as the number of taxed beverages, I report the more precise of the two measures, ounces.
[3] For the mathematically inclined. Fifty-three ounces has about 159 gm of sugar, at four calories per gram for a total of 636 fewer calories. Divided up among a 4-person household, this is 159 calories a month or 5+ calories a day. A sustained calorie reduction of about ten calories per day is believed to reduce weight by one pound.
Source: The Impact Of Sugar-Sweetened Beverage Taxes On Purchases: Evidence From Four City-Level Taxes In The U.S. National Bureau of Economic Research Working Paper 26393