Air pollution and COVID-19 share at least one attribute: their concentrations and your exposure differ inside and outside. Are we better off, indoors or outdoors?

Background
Man-made air pollution has been with us since the discovery of fire, although air pollution from forest fires and volcanic eruptions predated our involvement. The industrial revolution brought workers and industrial sources of pollutants together in crowded cities prompting a message to King Charles II in 1661 about the “inconvenience of the aer and smoak of London…” arising from burning high-sulfur coal [1]. Although that focus was on polluted outside air, this fuel was also used domestically and would have fouled the indoors as well.
By the mid-20th century, our mothers shooed us outdoors to get some “fresh air,” which, in fact, was dirty enough to require wiping off the porch furniture before use in part from burning coal for residential heating. When the Clean Air Act was enacted to control emissions from vehicles and smokestacks, we were urged to stay indoors on “smog alert” days, as is still the case. Early investigators found indoor air to be as polluted as outdoor air or worse, depending on cooking, heating systems, and indoor smoking. However, the Clean Air Act that defined the EPA’s air pollution mission failed to mention indoor air quality or our actual exposures. As COVID-19 continues to pose exposure concerns, we should ask, are we better off indoors or outdoors?
Indoor air quality was thoroughly covered in EPA’s 1982 and 1996 regulatory assessments. Several research campaigns were launched in the 1980s to investigate indoor/outdoor air quality relationships. They inventoried indoor sources, penetration of outdoor air, and differences between indoor air quality (room air) and individual personal exposures as determined from wearing monitoring instruments. However, the topic disappeared from the 2012 and 2019 reports and was discussed only briefly by the recent Clean Air Scientific Advisory Committee.
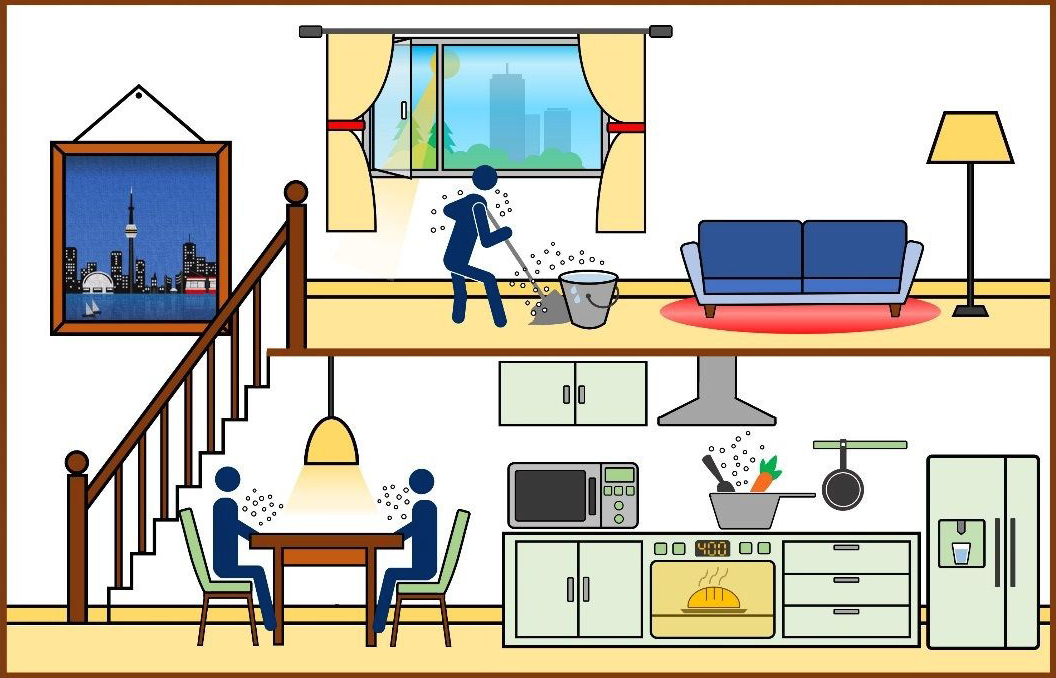
Indoor air pollution sources.
Three factors control indoor air quality. First is the entry of outdoor air into our rooms, infiltration. Typical rates average about 50% but can range from nil, in modern extremely energy-efficient buildings, to near 100% in poorly constructed buildings or those with many open windows.
Second, are indoor sources, as noted in the New Yorker:
- Environmental tobacco smoke (ETS) – CO (carbon monoxide), benzene, particulate matter (PM)
- Cooking – Nitrogen oxides, ultrafine PM, fumes from overcooking
- Fireplaces – PM, elemental carbon
- Pets – PM
- Cleaning – solvent fumes, various particulates
- Building materials, furniture - formaldehyde
- Air fresheners, personal hygiene products, perfumes
- Attached garages – CO
- Photocopiers/Printers – Ozone
- Candles – ultrafine carbon PM
- Matches – Sulfur dioxide (SO2)
- Various Allergens – dust mites, etc.
ETS is by far the most serious of these. Not only does it contain toxic compounds different from active smoking, but a single smoker can raise the indoor particulate concentration by 20 µg/m3 (the U.S. annual ambient standard is 12 µg/m3, and the Chinese healthy building indoor standard is 35 µg/m3). Pollution from residential combustion depends on the fuels available: natural gas/propane, the least; coal/wood the worst. Household cleaning practices and residential air conditioning are essential factors and vary with cultural and socioeconomic status.
Finally, there is an ill-defined category of “personal cloud” exposures, mainly particulates measured by monitors directly attached to individuals and for which clothing may act as a reservoir. Measuring individual exposures at various times and places remains more art than science.
The relative importance of these three factors depends on their magnitudes and distributions throughout the population at risk. For example, before air pollution controls were imposed, the outdoor PM may have been around 60 µg/m3, of which about 30 µg/m3 would penetrate indoors. If indoor sources contributed 10 µg/m3 and the personal cloud 5 µg/m3, then the total exposure would have been 45 µg/m3, dominated by the contributions from outdoors. However, thanks to the controls placed on emissions during the past 50 years, the mean outdoor PM level is now only about 10 µg/m3, while the contributions from indoor and personal sources would have remained roughly the same, for a total exposure of 25 µg/m3. Assuming a linear relationship with health, we would have expected to see an 83% improvement over time but only realized about 55%.
Epidemiologists analyze whether outdoor air quality during specific periods or places is hazardous, often in terms of increased mortality or illness rates. To simplify their calculations, epidemiologists make assumptions, typically that ambient air quality is uniform across a geographic area and that individual exposures are primarily from outdoors and remaining constant during that period. But this is clearly not the case, especially when one considers the variability in exposure to indoor air where we spend most of our time. Lacking this information, we must conclude that ambient air quality is one of many descriptors of location, like latitude, altitude, or population density, but cannot reflect the personal exposures of residents. Outdoor air quality is monitored and regulated and varies according to where you live; by contrast, indoor air quality depends on how you live. The problem here is not regulation of indoor air; instead, it’s that the health studies used to establish controls on ambient air quality failed to recognize exposures during the 85% of time that we spend indoors.
The current COVID-19 pandemic is relevant here as well. Recent studies indicate that most virus transmission occurs indoors [2], where virus aerosol is just another air pollutant with similar physical properties. The ultimate fate of these particles impacts our public health. Indoors in a still room, they may remain aloft for hours and then deposit on surfaces. Outdoors, ultrafine particles dissipate quickly due to air currents and the movements of pedestrians and vehicles.
What should we learn from this assessment?
- Indoor air quality can vary substantially from outdoor air within a given locale, even on the same street.
- Indoor air quality may be worse than outdoors, especially with smokers in the house.
- About half of the outdoor air pollution may infiltrate indoors.
- Each of us carries a “personal” cloud of particulate matter that may average 3-4 µg/m3 but can be much greater – making the current debate about reducing the ambient standard by 1 µg/m3 look foolish.
- Health effects estimates based on differences among outdoor air monitors rather than among affected individuals are not valid. Air pollution control strategies based on such assessments should be revisited.
- EPA has limited its scientific efforts to regulatory concerns, and thus we have no agency considering science-based environmental research.
- Avoid small indoor spaces that may be contaminated by a COVID-19 carrier.
[1] Evelyn, John. Fumifugium, 1661
[2] Airborne transmission of SARS-CoV-2: The world should face the reality. Environment International DOI: 10.1016/j.envint.2020.105730.
Housekeeping image a screenshot from The Atmospheric Chemistry of Indoor Environments, Environmental Science, DOI:10.1039/C9EM00386J
Background reading: US EPA, The Inside Story, A Guide to Indoor Air Quality,