Vaccination offers the best defense against COVID infection, hospitalization, or death. Effectiveness ranging from about 40% to 90% has been shown in various clinical studies depending upon the predominant variants of the virus, specific vaccines, and selected endpoints. Has vaccination “substantially reduced the burden of disease?”
A cost-benefit study determining the “return on investment” (ROI) of vaccination in New York City estimated a $10 reduction in healthcare costs for every dollar invested. [1] A national vaccine effectiveness study proclaimed:
“Vaccination in the US has substantially reduced the burden of disease despite the emergence of highly transmissible variants.”
We set out to evaluate this finding using recent population-based data, including the waning effectiveness of vaccines. We hypothesized three requirements for a successful vaccination program:
- Efficacy against current variants in clinical studies
- Acceptance by the public at large.
- Duration of effectiveness over time.
The first is required before a vaccine may be administered to the public. If the public largely resists, its practical value may never be known. The duration of vaccine efficacy cannot be determined until the program has been in place for six months or so.
Vaccination Distributions
National vaccine coverage has been poorly represented by focusing on the 69% of the population that has received the 2-shot original series. The CDC reports vaccine deliveries in terms of percentages of those eligible the 69% – their reporting of 50% receiving the first booster actually reflects the coverage of 35% of the US population. This “subterfuge” reflects the difference between emphasizing deliveries (CDC) and evaluating results (public health epidemiologists).
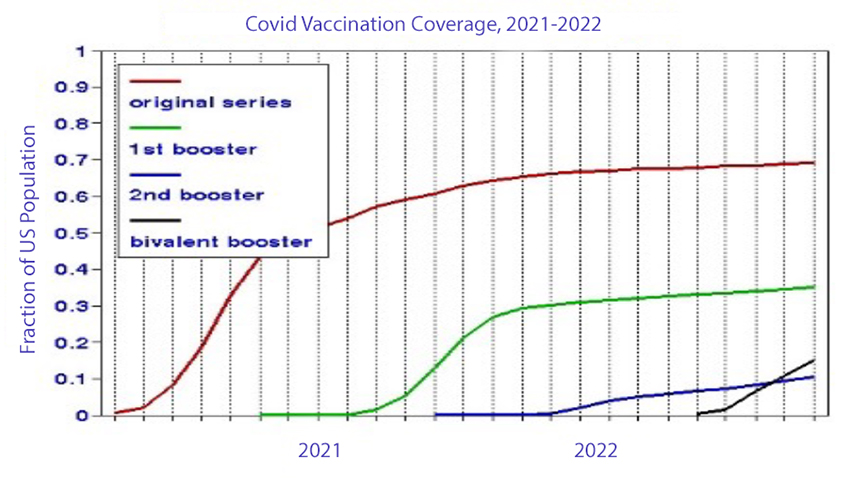 We took a fresh look at the CDC data from the various vaccine programs based on monthly average doses and their timing divided by the total US population (331 million), as shown in the graph. The total (cumulative) coverages in terms of the US population are:
- Original series 69%
- First booster 35%
- Second booster 10%
- Bivalent booster 15%
These data represent deliveries to the population as a whole; we have no information on the number of individuals receiving all four vaccinations.
This vaccination data protocol presents difficulties in terms of tracking individuals over time. It seems safe to assume that everyone receiving a booster also received the original series. But how many 2nd booster recipients also received the 1st one? Slightly more people got the bivalent dose than the 2nd booster; how many got both? Lacking such personal level information, we summed the various vaccine population percentages for each month.
Declining Effectiveness
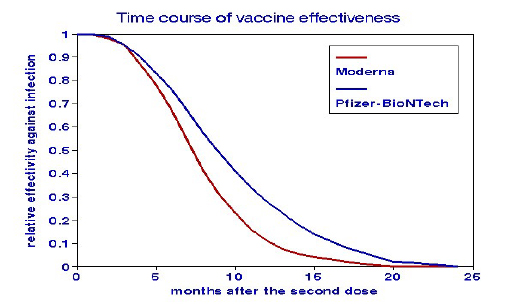 The delivery numbers refer to cumulative vaccinations since December 2022. Immunity conferred by vaccination wanes over time. Estimates of these rates have now appeared in the literature, as shown in the graph. The original series became ineffective by mid-2022. We found no such “deterioration” data for the Omicron variant and held the rate constant. We used those percentages to derive a mean deterioration rate of vaccine effectiveness for the entire pandemic.
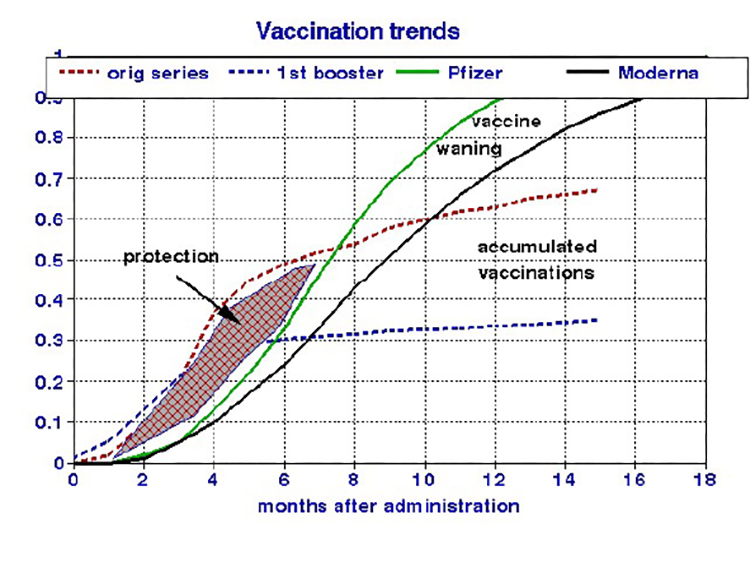
We estimated cumulative effective vaccine coverage as the percent efficacy at any point in time after vaccination. For example, the doses administered in January 2021 would have waned about 80% by January 2022 and would now be only about 20% effective. We calculated trends for the original series and the first booster program for effective vaccination by estimating the remaining effectiveness of each month’s dose as a function of elapsed time and then summing them over each calendar month. [2]
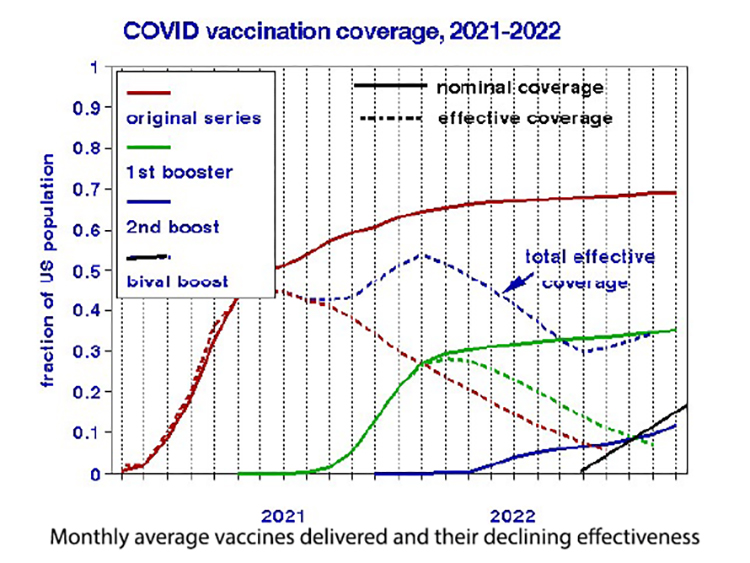
The peak effective coverage (54%) occurred in the winter of 2021-22 and then declined sharply to about 30% currently. It remains to be seen if the bivalent vaccine delivery rate will continue as shown, but it is apparent that the effective vaccine coverage in the US is substantially less than typically reported and likely to remain so.
It appears that the 1st booster program was about four months too late because its contribution coincided with the substantial waning of the original series. Earlier timing could have increased the total effective coverage to 70%. Of course, 20-20 hindsight into the waning response to vaccination would have been required.
Implications
Effective vaccination coverage depends on the interplay between rates of additional doses (gains) and the deterioration of previous ones (losses), which are independent processes. Vaccination delivery rates for newly available vaccines depend on the trade-off between individual reluctance and public health promotion. Waning vaccine protection is physiologic and interacts with new, resistant variants. The graph compares the histories of increased vaccination rates (dashed lines) with increasing deterioration due to waned effectiveness (solid lines). Additional vaccinations confer no further public health benefits when these rates are equal. Where the rate of waning efficacy exceeds new vaccinations, as shown on the right side of the graph, we would expect more COVID cases. By contrast, the cross-hatched area indicates where vaccination was administered before the previous doses had time to deteriorate, enhancing coverage. In this presentation, increasing the initial vaccination rate is seen as the most effective way to enlarge public health protection.
 The overall efficacy of vaccination should be judged based on integration over time – it is not one-and-done. Maintaining public health in this age of COVID could require a flu-like regimen of semi-annual injections.
[1] That would be an ROI of 10; generally, an ROI approaching one is considered an excellent financial investment.
[2] ] The subsequent boosters have not been in place long enough to have waned significantly.