The chemistry of global warming (GW) driven by heat-trapping air pollutants is measured and reported. Various mathematical models have been used to project future global scenarios. Since natural sources of greenhouse agents are largely beyond our control, here we focus on anthropogenic sources mainly involving combustion – typically byproducts, rather than end products. I use statistical methods to estimate the situation in 2050.

Evolution by natural selection suggests that organisms adapt to their environments. Humans have been highly successful in adapting by modifying their surroundings to meet their needs and wants, creating unintended consequences that include impacts on climate.
Human Respiration
CO2 concentrations in exhaled breath are significantly higher than inhaled air, typically around 4 -5% vs. 0.4%—the increased concentration results from eliminating this “waste gas” produced during our body’s cellular respiration. Annual CO2 exhalation is about 380 kg per person for a global total of about 3 billion metric tons, about 9% of global anthropogenic emissions. Given the long history of human CO2 exhalation and CO2’s long atmospheric lifetime, human respiration could have contributed appreciably to the current atmospheric burden. [1]
Spatial Relationships Among States
I examined cause-and-effect relationships for greenhouse parameters using spatial gradients among the contiguous US states.
Predictor Variables (causes)
- Total energy consumption (Btu per capita).
- Total energy production (Btu per capita).
- Vehicle miles traveled (VMT) per capita.
- Household income, US$.
- Gross domestic product (GDP, US$ per capita).
- Retail price of electricity ($MWh).
Outcome Variables (effects)
- CO2 emissions per capita.
- Natural gas (CH4) production per capita - a surrogate for ambient methane.
- Ambient nitrogen oxides (NOx) concentrations - a surrogate for ambient nitrous oxide (N2O).
- Ambient elemental carbon concentrations (EC).
- Ambient fine particle (PM2.5) concentrations - a surrogate for ambient sulfur (SO4).
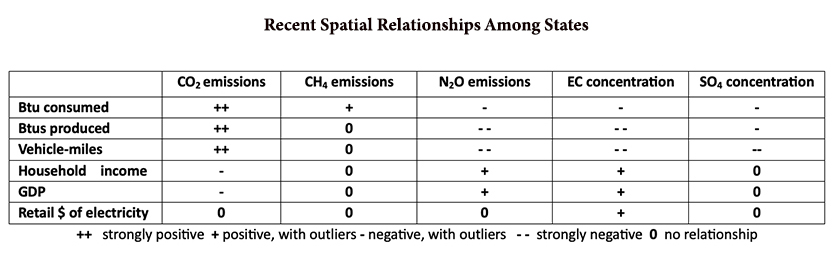
Energy production, consumption, and traffic (VMT) have the strongest relationship with CO2 emission rates. Relationships with methane were largely unimportant, primarily because natural gas production is concentrated in a few states. The retail price of electricity was not a factor, and there was no relationship between state-level GDP and CO2 emissions. Producing or consuming energy did not worsen air quality, for which differences in population density may have played a role.
I used multivariate regressions to estimate the combined effects of energy consumption, production, and traffic on CO2 emission rates. [2] Energy consumption was the best predictor of CO2 emissions with a 1:1 relationship; energy production was a weaker predictor. Vehicle miles traveled had an intermediate relationship that was not statistically significant.
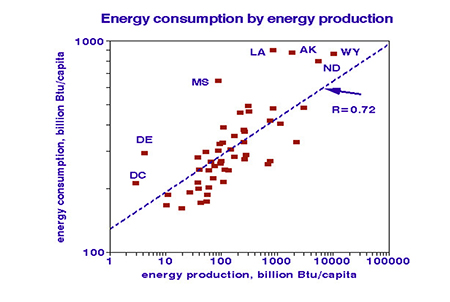 The relationship between energy produced and consumed among states was also statistically significant, indicating that residents of energy-producing states tend to be heavier consumers (see graph). States ' per capita energy consumption rates are much more uniform than energy production rates.
Because of differences in imports and exports among states, their distribution of per-capita electricity generation shows an extensive range. Most states consume about 1 kilowatt-hour per day per person on average, but rates are much higher in some sparsely populated western states.
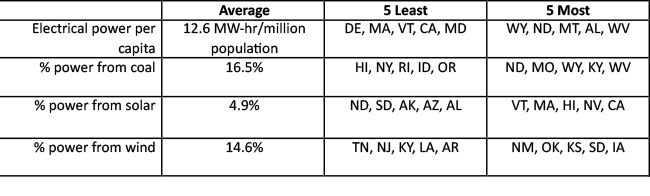
States producing the most power per capita tended to rely on coal, but solar power was relatively important in New England as in states with more favorable climates. Wind power was significant in central states, as expected. [3]
National And International Data
Comparisons among states are of interest concerning domestic energy policies, but national data are more relevant for global considerations. The US share of global CO2 emissions has decreased steadily since 1960, so only about 5% would be predicted by 2050. This emphasizes the urgency of international cooperation.
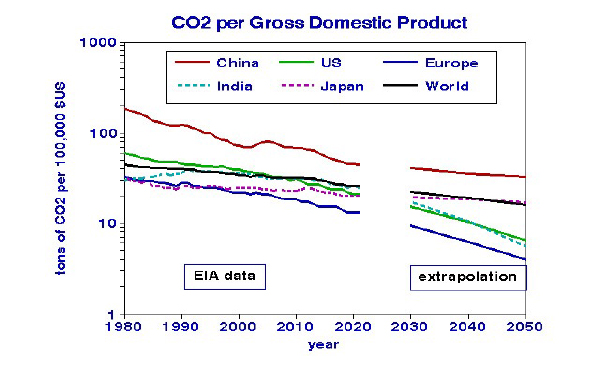
Global analysis considers trends among GW factors integrated over many disparate populations. The world's nations differ in cultural and economic characteristics, including sources and energy uses. GDP captures many of these characteristics; the ratio of CO2 emission rate to GDP measures the importance of CO2-producing activities to overall economies. Per capita GDP per capita responds to increased productivity, technological advances, and improvements in infrastructure as well as inflation. CO2 emissions are highly dependent on the types of fuels available, especially for generating electric power. However, GDP was not an important predictor of CO2 differences between US states.
The US Energy Information Agency (EIA) provides data from 1980 to 2020, which I extrapolate to 2050. GDP has been increasing exponentially worldwide (hence the logarithmic scale), much faster than CO2 emissions, leading to decreasing ratios in the US, Europe, and India. CO2/GDP has remained steady in Japan and tended to level off in China following earlier steep declines as the economy shifted from agricultural to industrial. The global trend resembles that of China, suggesting similar rates of development elsewhere.
For Coal – “When energy is scarce, coal can be a lifeline.”
The Economist considered the projected demise of coal in the context of financial markets and supplies of other fuels. They concluded that coal is not dead; it’s not even sick! Demand is stubbornly driven by the desire for economic growth, and solid fuels are easier to import than gaseous.
Consider the conundrum: as demand for renewables increases because of environmental preferences, prices follow suit, growing markets for relatively cheaper (and dirtier) coal. Coal production hit a record last year.
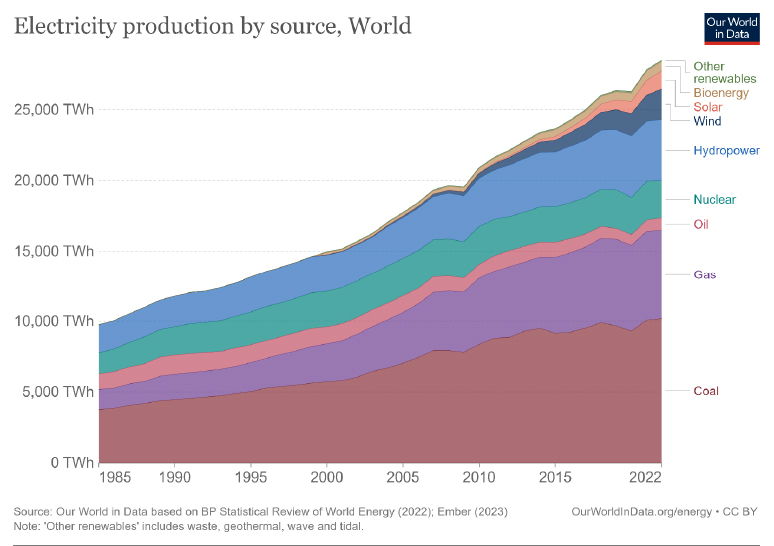
The global trend lines show how per capita electric power usage continues to grow; wind and solar energy sources comprise tiny fractions of the total. Hydroelectric and nuclear power continue to dominate the non-fossil energy sources.
The global trend lines show how per capita electric power usage continues to grow, and wind and solar energy sources continue to be a tiny fraction of the total. Shares of hydroelectric and nuclear power dominate non-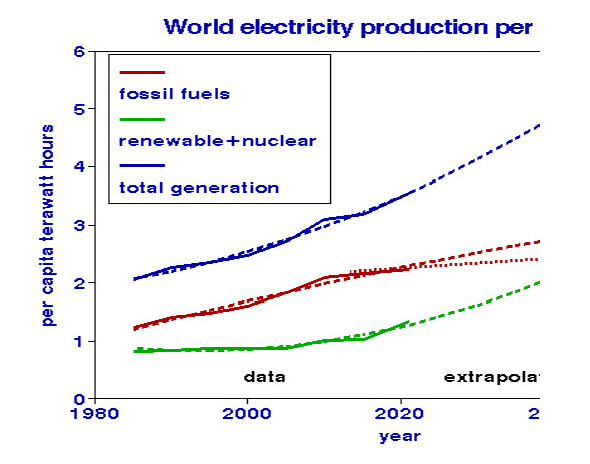 fossil energy sources. My extrapolated electricity trend graph projects that renewable and fossil sources will converge by 2050. The trend line for fossil sources shows a reduction beginning about 2015 that may or may not continue. Even with diminishing proportionate use of fossil fuels, my analysis indicates that fossil fuels absolute amounts continue to increase, and there are no indications of renewable energy displacing coal.
What Does It All Mean?
I focused on CO2 because of the available data; a more complete analysis must consider methane and other greenhouse agents. I presented many facts, figures, and relationships; here’s what I’m taking away.
- Individuals contribute to the atmospheric CO2 burden by their being (respiration) and their activities of daily living.
- Among US States, energy consumption, production, and vehicular traffic are the most critical contributors to CO2 emissions. The use of a specific energy source to generate electricity varies from nothing to a majority.
- Reducing total CO2 emissions requires more renewables and less coal.
- Adding (renewable) facilities is relatively easy; retiring an existing (coal-fired) facility is expensive.
- Conversion from coal to natural gas can reduce CO2 emissions in half but will depend on fuel availability and relative costs.
- US contributions to global CO2 will be much less important by 2050.
[1] About 45% of emitted CO2 makes it into the atmospheric reservoir.
[2] For this purpose, I used quadratic (2nd order) regression equations that fit the measured data very well with correlation coefficients of around 0.9.
[3]