Local surveillance of COVID-19 in wastewater (WW) is widespread and reported by the National Wastewater Surveillance System (NWSS). We previously used NWSS data to examine national trends and relationships in attempts at wastewater epidemiology (WWE). Now, we consider the consistency of geographic trends at scales ranging from local treatment plants in the five boroughs of New York City to statewide coverage.
“….wastewater data reflect both temporal and geographic trends in COVID-19 disease burden across the United States...”
Claire Duvallet et al., in Environmental Science and Technology Water
NWSS reports changes in COVID-19 wastewater samples over 15-day intervals but not the actual viral loadings reported by the CDC’s COVID data tracker. Peak loads are characterized by positive changes followed by negatives, with percentage changes calculated by dividing the increments by the initial values. [1]
Previous Geographic Analyses
Duvallet et al. plotted monthly trends in viral loadings from 55 locations, comparing them with clinical determinations of COVID-19 cases from April 2020 to May 2021, a period that included a major spike due to the arrival of the Delta virus. They found WW sampling to predict COVID-19 infection peaks to be both site-specific and time-dependent, but advanced notice of an impending infection spike was seldom provided.
Trends in New York City
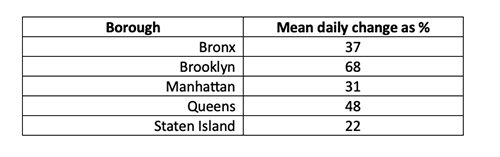 Changes in daily wastewater concentrations varied substantially in the 5 NYC boroughs but were not significantly different when averaged over July and August, with an overall NYC daily wastewater mean change of 41%, suggesting that city-wide averages were more reliable than data from any single treatment plant. For comparison, New York State reported a 34% increase in statewide COVID-19 hospitalization during 15 days in September.
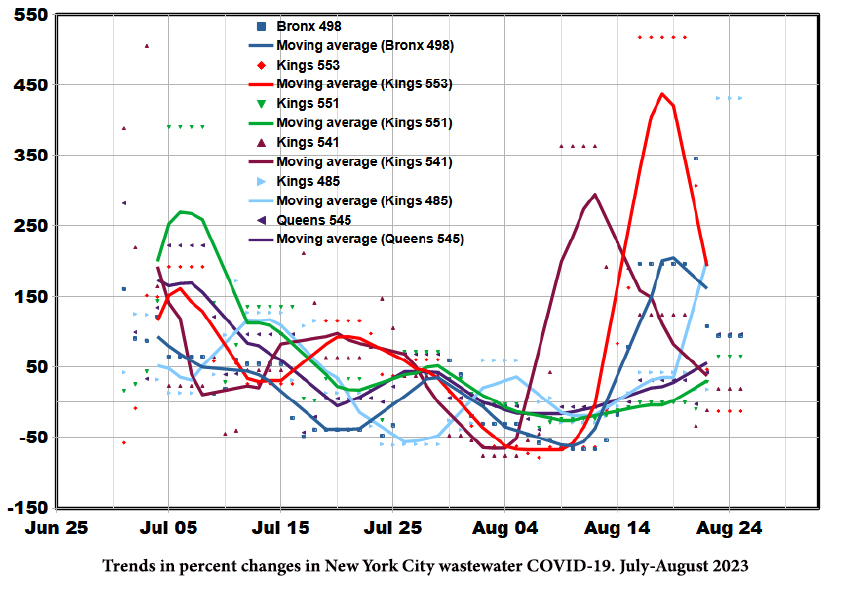
Trends in daily concentration changes at selected treatment plants were uniformly negative during July, indicating decreasing concentrations that peaked in early August and followed by modest rates of decline and subsequent higher rates of increase that differed among plants. There are substantial differences among the four Kings County (Brooklyn) sites in August.
New York City’s Spatial Variability
We used data from July and August for eight treatment plants, 4 in Brooklyn and 1 in each of the other four boroughs, to examine spatial variations. Among the 8 plants, Queens and New York (Manhattan) were the most closely linked to others, and the Staten Island plant was the least. We expected to find the strongest relationships among the 4 Brooklyn plants, but none of those relationships was statistically significant. We had no information on possible reasons for this dispersion among plants in Brooklyn, which could have been due to local sources or experimental anomalies.
New York State Data
New York State Department of Health tracks data from 175 treatment plants in 59 counties and summarized COVID changes in late September as
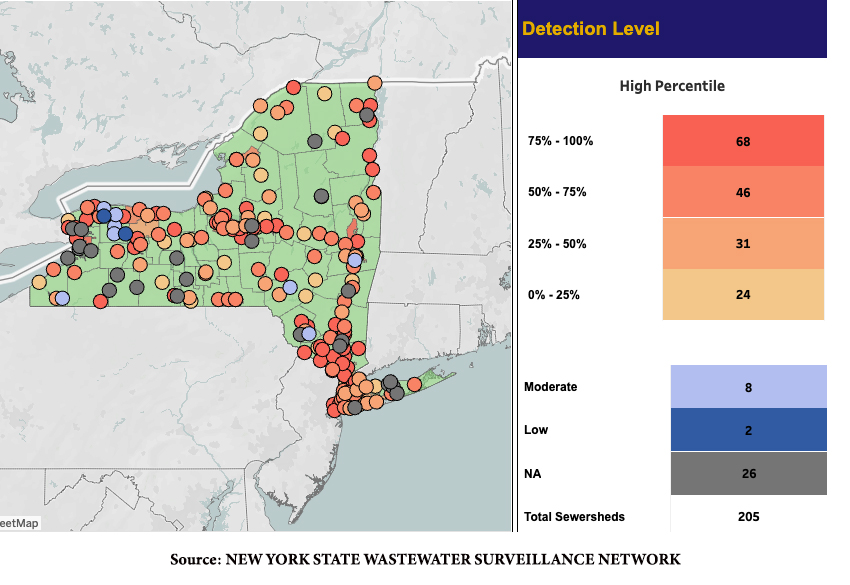
- 19 site reductions
- 83 with no change
- 71 site increases
The state map shows no consistent geographic patterns save for increasing levels in New York City and Cattaraugus County.
A meta-analysis of wastewater surveillance revealed that extrinsic factors explained about 50% of the variations in national prevalence data. Our analysis of New York City treatment plants is consistent with this conclusion. Earlier, we wrote,
“(WWE) may play a role in more precisely identifying geographic locations and populations of concern for targeted interventions.”
Today we must say, “not so much.”
[1] We noted large positive (but not negative) percent changes likely due to dividing the increments by initial values near zero. We eliminated such sampling sites to avoid bias in our statistical analyses.