Researchers examining the city's water system have produced some concerning data. Meanwhile, there's no reason anyone’s drinking water should be contaminated with lead. However, other than raising awareness of the problem, this study does little other than stir the water.

“Chicago is estimated to have nearly 400,000 lead service lines (where one line serves approximately one household), the most of any US city. Despite efforts to identify and replace lead service lines, progress has been slow, with only 280 (0.007%) lead pipes replaced by the city government from 2020 to 2022.”
These are concerning numbers from the point of view of the lead service lines in Chicago, as well as the evident inability of local officials to effectuate any meaningful change in a significant health risk. In a study relying significantly on Mathmagic and estimates, the authors estimate that “two-thirds of children are exposed to lead-contaminated drinking water. Could that be true?
To reach that conclusion, the researchers used several datasets. The ground truth data were lead levels found in tap water of 38,385 households. This data was then matched with demographic and health data at the aggregated block level – aggregation resulted in averages with less precision and more uncertainty. The first assumption was that a lead level of 1 part per billion (ppb) was the at-risk value stating that there was no acceptable level of lead and that 1 ppb was at the limits of detection. The EPA sets a standard of 15ppb in 10% of households before remediation is necessary.
- “Machine learning” was used to identify blocks at risk, defined as 50% of households having >1ppb of lead.
- Lead exposure for children was based on those blocks deemed at risk multiplied by the block-level data of children under five and under 10 – another series of aggregations and approximations with less precision and certainty.
- Blood lead levels were approximated from studies in children aged 1 to 5 in Canada after 150 days of exposure.
Results
- Across approximately 36% of Chicago's census tract residential blocks, 69% yielded lead-contaminated tap water. However, only 20% of the households surveyed used unfiltered tap water, reducing the at-risk population to 13.8%, with lead-contaminated tap water as their " primary drinking water source.” It's not a good finding by any stretch, but certainly not the more widely touted 69%.
- The machine learning model estimated that 75% of census blocks were at risk, with blocks with larger populations at lower estimated risk and those with a greater building density at higher estimated risk.
- As block-level Black and Hispanic populations increased, screening for lead decreased, and lead exposure increased. For block-level White populations, screening for lead increased with increasing population, and lead exposure decreased. Certainly, there is an argument for another socioeconomic health disparity. However, it is essential to note that the testing, which was the ground truth for this study, is from a “free self-administered testing service for lead exposure.” Moreover, Black and Hispanic survey respondents used only half as much unfiltered tap water as their White brethren.
- “A total of 129,000 of all children younger than 6 years (68%; 95% uncertainty) were estimated to be exposed to lead-contaminated water. An estimated 19% of exposed children (n = 22 400) used unfiltered tap water as their primary drinking water source, corresponding to an estimated 103% (95% uncertainty) increase in BLLs after 150 days of exposure.” [emphasis added]
That is a great deal of uncertainty and a bit of wordplay. The much-reported 68% of Chicago children exposed to lead-contaminated tap water drops nearly six-fold, down to 13% or so when considering who might be at actual risk of drinking that water. And even then there remains that 95% uncertainty.
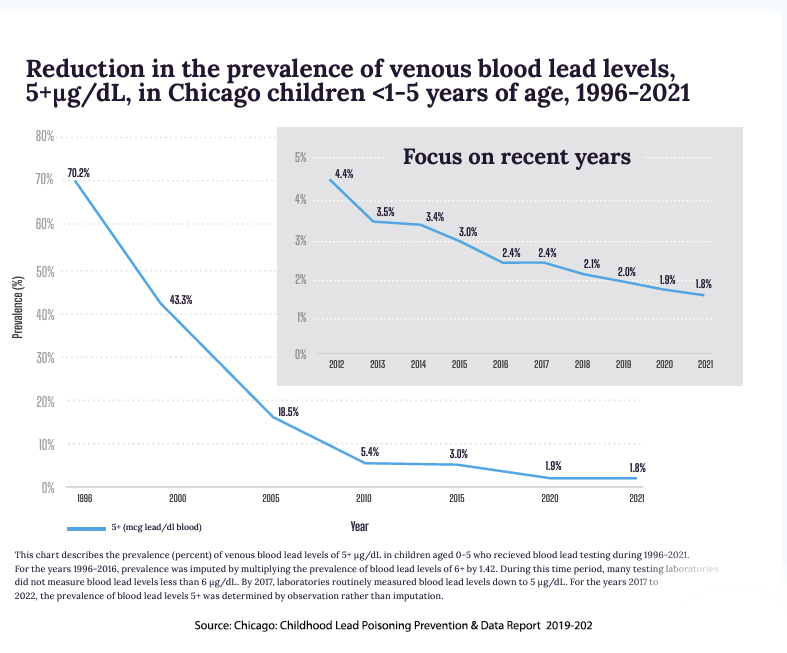 Let me be clear: there is no reason anyone’s drinking water should be contaminated with lead. But this study does little other than stir the water. They point out that bottled water may have up to 5 ppb of lead and that filtration does not always remove lead from water. They make the obligatory reference to the systemic racism and historical segregation of Chicago in explaining where these disparities are located. The graph shows the actual number of children aged 1 to 5 with documented blood lead levels. While few of the pipes in the buildings have been removed, the public health risk continues to diminish.
However, other than “contributing to the existing literature” or extending “the literature by using machine learning models to estimate out-of-sample population-level prevalence of lead exposure,” what have they accomplished? Have they raised awareness, or has their methodology, involving aggregation and statistical manipulation, guaranteed to introduce significant uncertainty, provided more fodder for those that will continue to sit on the governmental purse strings needed to correct the problem?
Addressing the lead service line crisis demands more than academic discourse; it necessitates decisive action, robust policies, and sustained advocacy to safeguard the health and well-being of Chicago's residents.
Source: Estimated Childhood Lead Exposure From Drinking Water in Chicago JAMA Pediatrics DOI: 10.1001/jamapediatrics.2024.0133