Public health officials and the media have been warning us that coronavirus kills not just old or immunocompromised people but young people too. While this is true, it remains relatively uncommon.
The CDC has accumulated mortality data about the COVID-19 pandemic from February 1 to June 17. Using this, it is easy to summarize how the disease has impacted Americans differentially based on age and race. Bear in mind, that the CDC's mortality data often lags behind other sources. (For example, the death toll in the United States according to Johns Hopkins is over 120k, but the CDC's most recent data only shows roughly 103k.) Still, this shouldn't impact the age and race analysis.
U.S. Coronavirus Deaths by Age
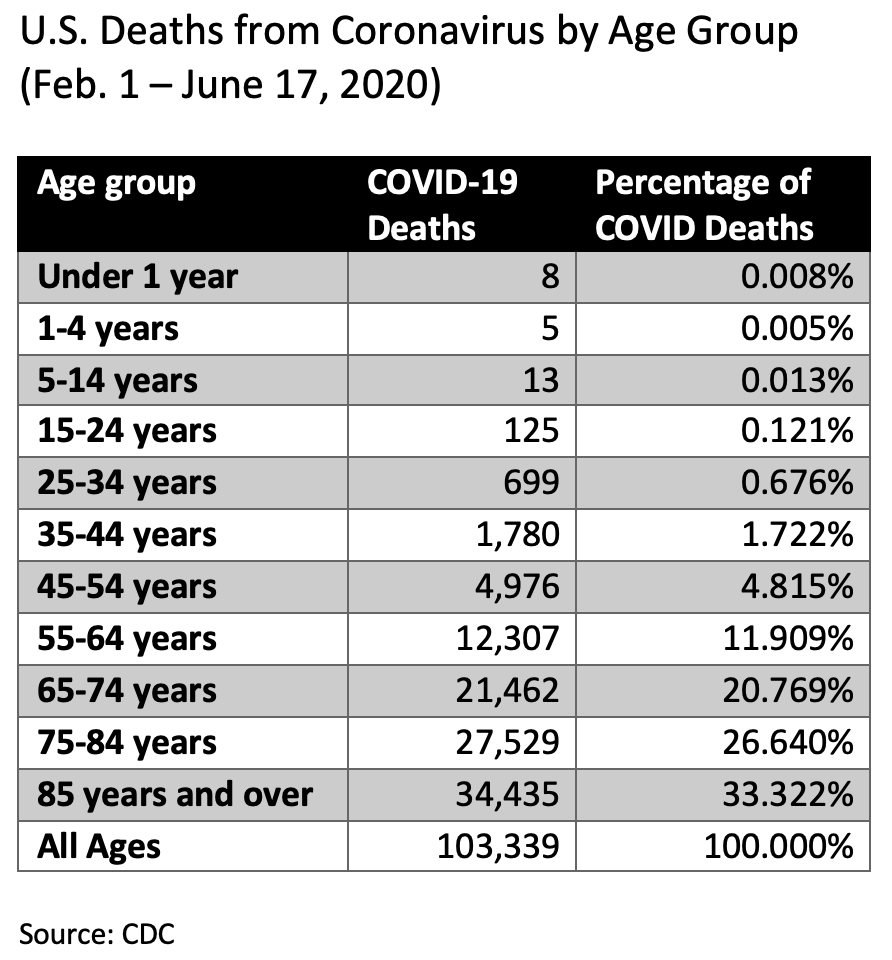
Here's the coronavirus mortality data by age group:

As shown, deaths in young people (from babies to college students) are almost non-existent. The first age group to provide a substantial contribution to the death toll is 45-54 years, who contribute nearly 5% of all coronavirus deaths. More than 80% of deaths occur in people aged 65 and over. That increases to over 92% if the 55-64 age group is included.
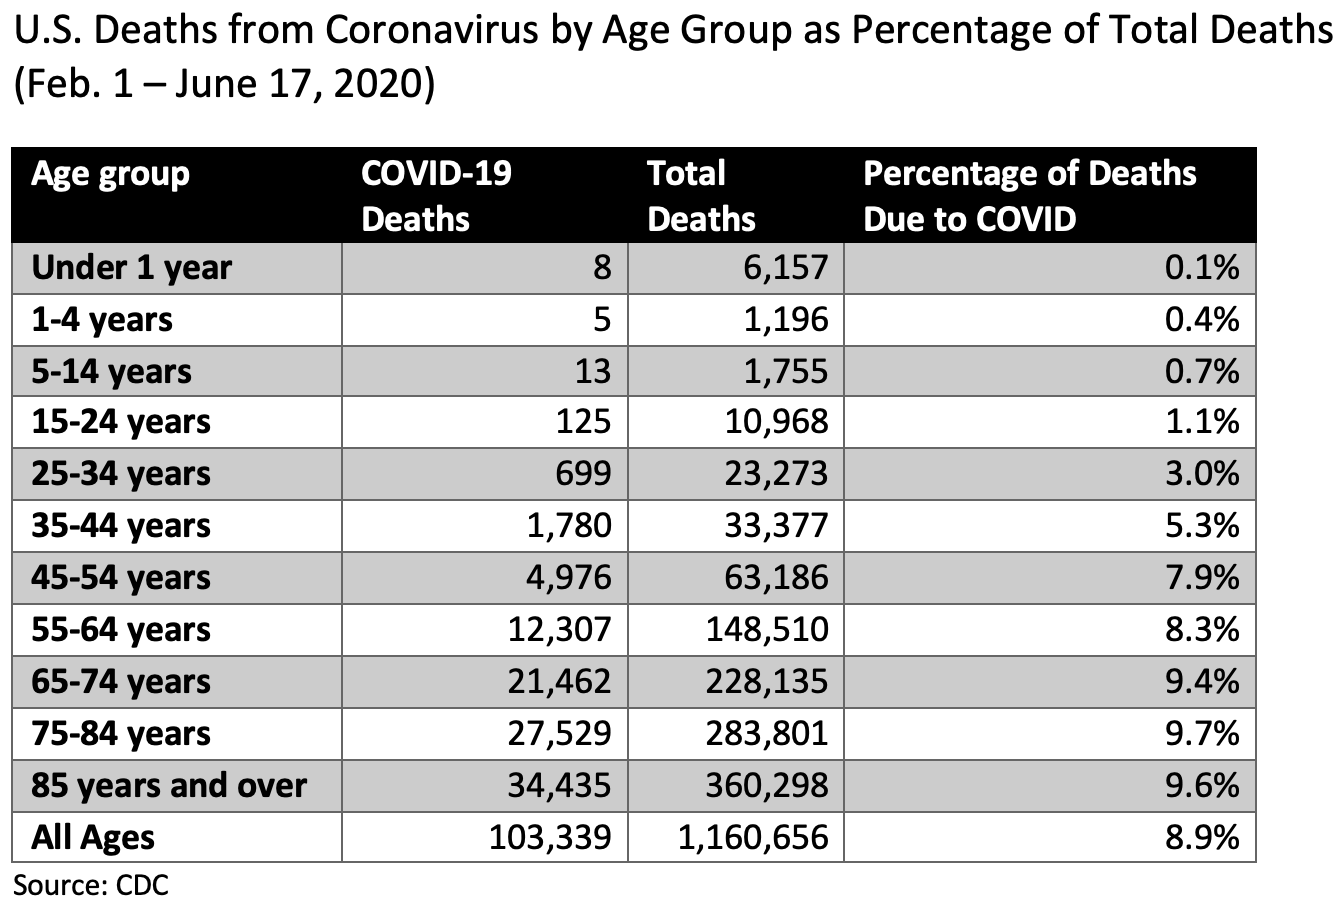
One thing that is often forgotten is that people of all ages are dying all the time. Each year, about 2.8 million Americans pass away. The following chart shows the percentage of deaths in each age group that were due to coronavirus:

Of the roughly 1.2 million American deaths that occurred between February 1 and June 17, almost 9% were due to coronavirus. The proportion of deaths due to coronavirus were about the same for each age group above 45 years. Below that, the proportion of deaths due to coronavirus fell dramatically. Thirteen children of primary and middle school age (5-14 years) died from COVID-19, but this represented only 0.7% of all deaths in this age group; 1,742 kids died of other things during this same time period.
U.S. Coronavirus Deaths by Race
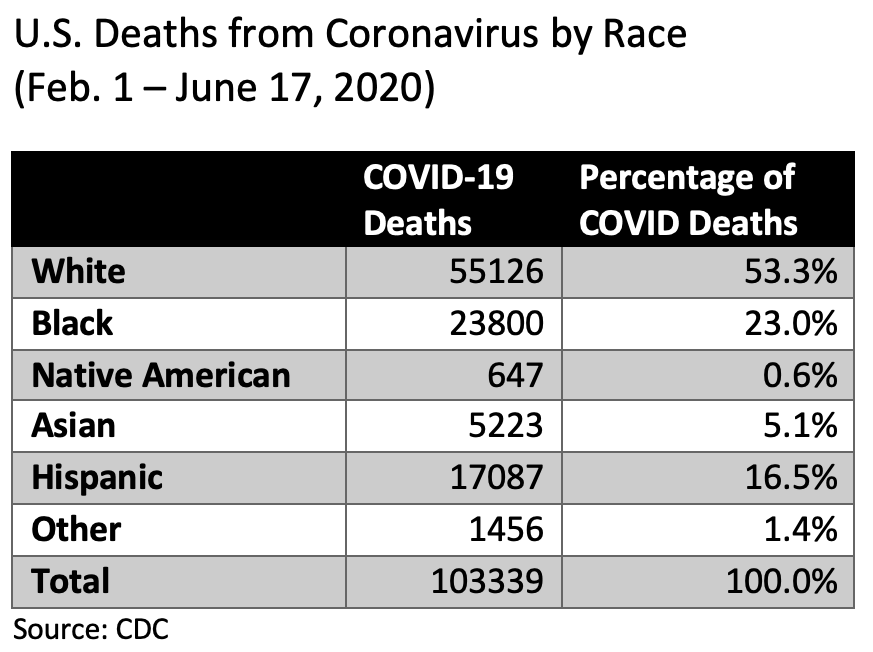
The following chart depicts U.S. coronavirus deaths by race.

The number that stands out here is the percentage of COVID deaths that occurred among Black Americans. Blacks constitute about 13% of the U.S. population but suffered 23% of all COVID deaths.
Risk of Death from Coronavirus: COVID-19 Infection Fatality Rate (IFR)
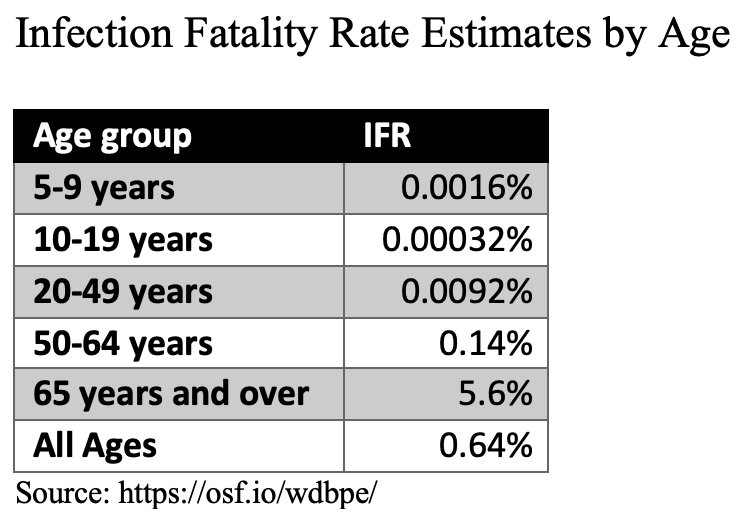
None of the above data answers the question, "What is my risk of dying from coronavirus if I get infected?" For that, we need to look at the infection fatality rate (IFR), which is the percentage of people who die given that they are infected. (This includes people with asymptomatic infections or those who are infected but never get tested.) One group believes the range is 0.1% to 0.41% (with a point estimate of 0.28%). Another group, which examined deaths in Geneva, Switzerland, concluded that the overall IFR is 0.38% to 0.98% (with a point estimate of 0.64%.)
Of course, IFR varies depending on age. Young people are far less likely to die than older people. The Swiss study estimated IFR's by age group:

While coronavirus is obviously concerning and a very real threat to some people (namely, the elderly and immunocompromised), these data also show that the risk for the rest of the population is quite low.
CDC Data Sources (Accessed on 23-June-2020)
(1) https://data.cdc.gov/NCHS/Provisional-COVID-19-Death-Counts-by-Sex-Age-and-S/9bhg-hcku
(2) https://data.cdc.gov/NCHS/Provisional-Death-Counts-for-Coronavirus-Disease-C/pj7m-y5uh


