Taxes alter consumer behavior. The more something is taxed, the less of it we get. Knowing this, governments use taxes to encourage or discourage behavior. For instance, cigarette taxes were an important tool in decreasing the prevalence of smoking.
Now, governments are trying to address the obesity epidemic using the same strategy. In recent years, “soda taxes” have become a popular policy option. Do they work?
The data is mixed. A review paper published in 2023 along with a subsequent summary article published in Knowable Magazinein February 2024 found no conclusive evidence that taxes on “sugar-sweetened beverages” changed consumer behavior in any meaningful way. They cite the example of Philadelphia, which implemented one such tax and witnessed a drop in demand of46%. This would be impressive if it wasn’t for the fact that most consumers either switched to another (also unhealthy) beverage or simply left the city limits when they wanted to purchase a soda.
Soda-less in Seattle
Would the outcome be any better in Seattle? A new study just published in JAMA Network Open sought to determine if Seattle’s tax had a tangible impact on public health. Media outlets (like here and here) that reported on the research concluded yes. But, as we have come to expect from the media, none of them took the time to critically analyze the data — andit paints a much murkier picture than the media is reporting.
The study was well done and data intensive. It followed children aged 2 to 18 who lived in Seattle (where the soda tax was implemented on January 1, 2018) or in urban areas outside Seattle (where there was no soda tax) over the course of a few years to determine if the tax resulted in a decrease in body mass index (BMI).
BMI is a tricky statistic, especially when the analysis involves growing children who are supposed to gain weight as they get older. In part to account for this, the authors relied on a similar but difficult-to-understand metric called BMIp95.
A child is considered overweight or obese if their BMI is at the 95th percentile or above for their age, height, and sex. For example, consider a 5’10”, 16-year-old boy. The 95th percentile for BMI is 27.6, which converts to a weight of 192 pounds. So, any 5’10”, 16-year-old boy who is 192 pounds or heavier is considered overweight or obese. (Here is a BMI calculator.)
To determine the BMIp95, the authors calculated BMIs for all the children, and then divided their BMIs by the 95th percentile for their respective age, height, and sex. If a 5’10”, 16-year-old boy weighed 155 pounds, his BMI is 22.3. Because the 95th percentile for that age, height, and sex cohort has a BMI of 27.6, then this child’s BMIp95 = 22.3 / 27.6 = 81%.
In this way, the authors determined the BMIp95 for Seattle and the surrounding areas both before and after the tax was implemented. (See table below.) They found that BMIp95 dropped from 84% pre-tax to 82% post-tax in Seattle (green highlights), while BMIp95 only dropped from 86% to 85% (yellow highlights) in the surrounding (non-taxed) area. Therefore, in the authors’ opinion, the tax worked. And that’s what the media reported.
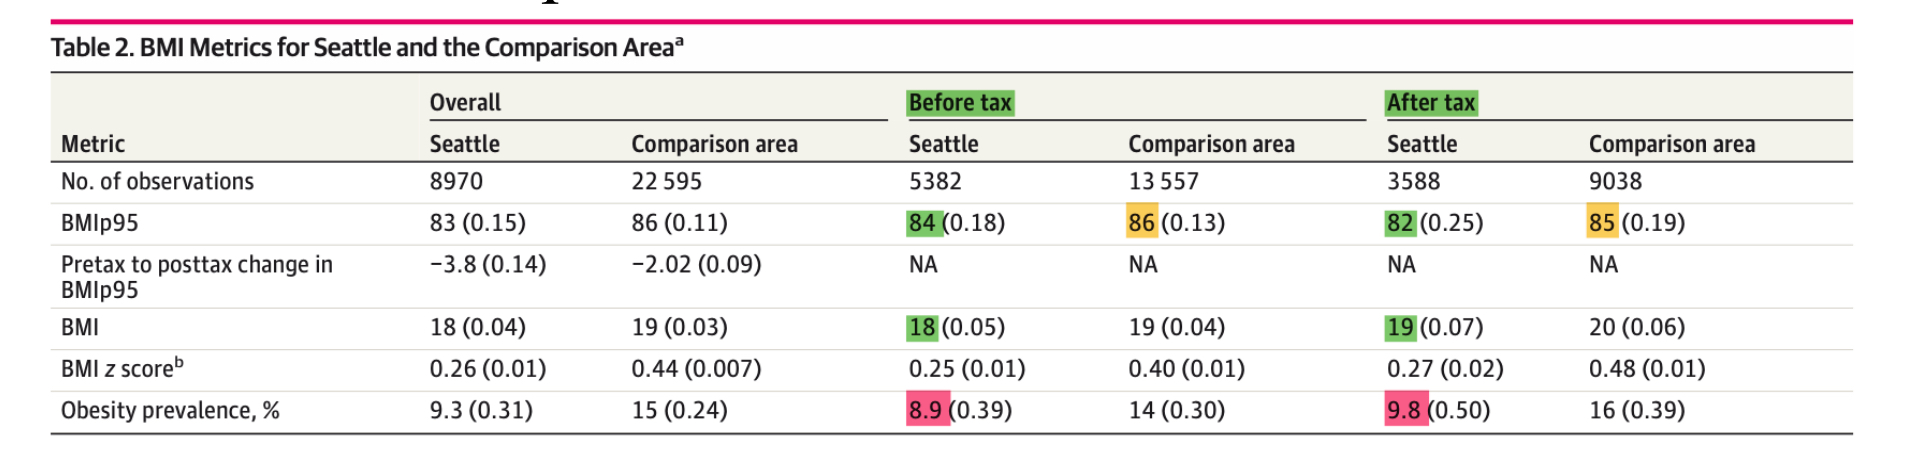
Source: Jones-Smith JC et al, JAMA Network Open, 2024.
But hold on. Notice the numbers highlighted in pink, which represent the prevalence of childhood obesity. That number increased from 8.9% pre-tax to 9.8% post-tax in Seattle. Similarly, it increased from 14% to 16% outside Seattle. What is going on? How can BMIp95 be decreasing while overall obesity is increasing?
A murky picture
I contacted the authors, who very graciously explained their data and provided additional figures. The one below, which represents Seattle (and which I edited to include a red arrow), shows how BMIp95 changed after the tax.
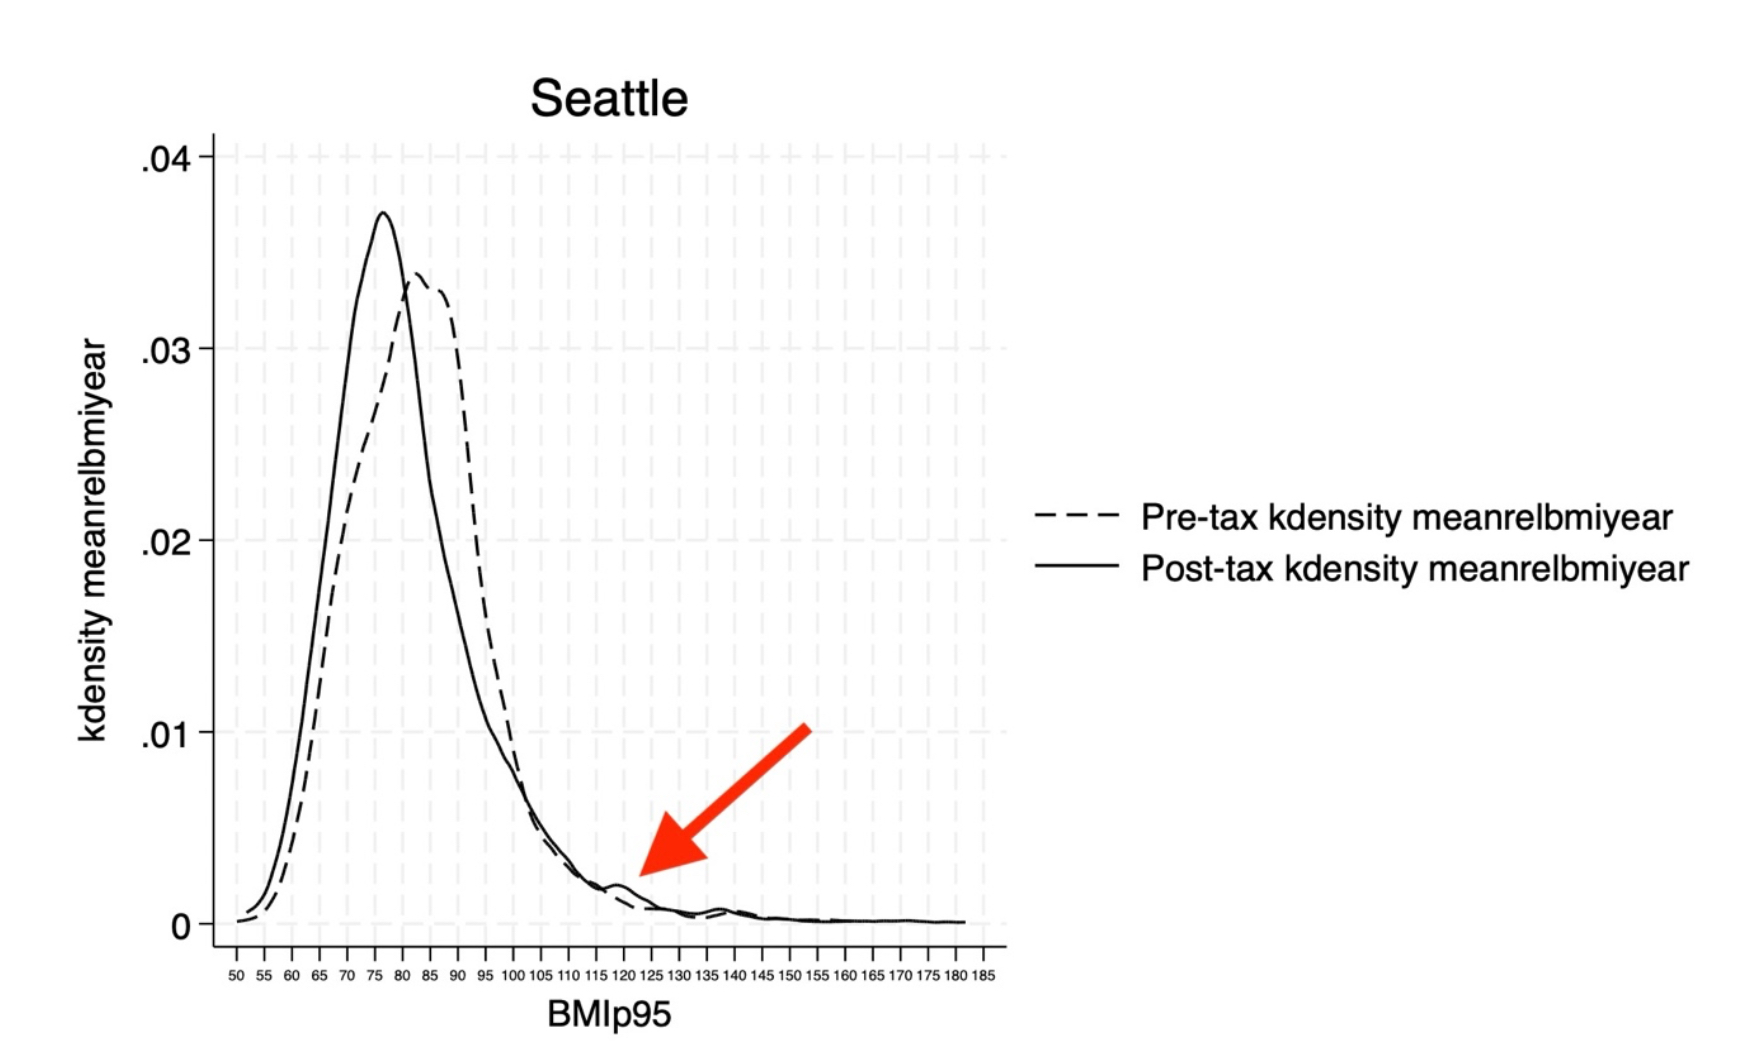
Courtesy of the authors
Dr. Jessica Jones-Smith explained that while the overall BMIp95 curve shifted leftward / lower after the tax, there was a small group of children (red arrow) that shifted rightward / upward. In other words, while the population as a whole lost weight (represented by the drop in BMIp95), a small number got heavier (represented by the increase in obesity prevalence).
Let’s go back to our example 5’10”, 16-year-old boy. If he has a BMIp95 of 84% (which is the pre-tax Seattle BMIp95), then he weighs 161 pounds. One year later, at age 17, the BMI 95th percentile for 5’10” boys (assuming he didn’t grow in height) is 28.3, or 197 pounds. If his BMIp95 fell to 82% (which is the post-tax Seattle BMIp95), then he stayed the same weight (161 pounds) as opposed to weighing 166 pounds.
Is this clinically significant? Dr. Jones-Smith says yes. I’m not so sure.
There are two other issues. First, a drop in BMIp95 also occurred outside the city of Seattle, suggesting that factors other than a soda tax are at play. While the decrease in Seattle was larger, it was not substantially so. (A statistically significant difference is not necessarily a meaningful one.)
Second, and more importantly, the entire point of the soda tax is to decrease obesity, not BMI. This is an important distinction. A child with a healthy BMI doesn’t need to lose weight, but an obese child does. Yet, the prevalence of obesity increased after the tax, which indicates to me that the policy failed.
Source: Jones-Smith JC et al, JAMA Network Open, 2024.

Alex Berezow, PhD
Former Vice President of Scientific Communications
Dr. Alex Berezow is a PhD microbiologist, science writer, and public speaker who specializes in the debunking of junk science for the American Council on Science and Health. He is also a member of the USA Today Board of Contributors and a featured speaker for The Insight Bureau. Formerly, he was the founding editor of RealClearScience.