The healthcare conversation seems to have been put on the back burner as our federal government twists and turns over other more “pressing” issues. Drug costs, expanded or contracted coverage, the financial burden of healthcare, surprise billing all are in the shade, easily forgotten in a media that has no attention span.
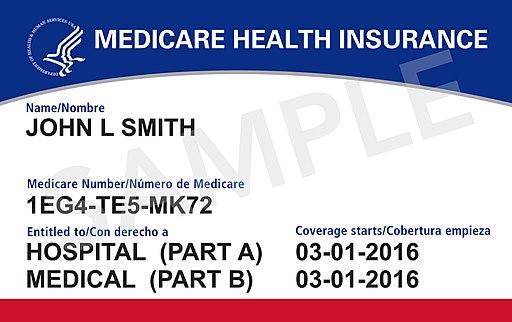
We should take advantage of the lull to learn a bit more about Medicare, after all, it is our largest healthcare payer. Few of us are so ill that we spend significant time in our healthcare system – a hernia, delivery, C-section, or arthroscopy are not as intense as being hospitalized for pneumonia or a heart attack. While those receiving Medicare understand how it works and what it costs, the population that would be impacted by Medicare for All or its many variations, the well, have no experience with Medicare.
This week Medicare released an infographic showing what it is providing this year. A few quick caveats. It is an average across the Medicare population, the “sickest” among us; so your needs for care will vary. But your insurance coverage is also an average, so while we may be comparing a Honey Crisp apple to a MacIntosh, we are not comparing apples to oranges. Much of the cost of hospitalization is completely covered by Medicare, your annual deductible $1316. Emergency room care is completely covered. Physician charges are paid at 80% of allowable and your annual deductible is $185. Drug pricing remains too opaque to summarize.
Ask yourself this, how does Medicare measure up to your current health plan? To steal a phrase, “what’s in your wallet,” when it comes to healthcare insurance?

Source: https://www.cms.gov/Research-Statistics-Data-and-Systems/Statistics-Tren...


