Before jumping into the study, let’s take a moment to talk about R0, that standard measure of infectious transmission. I am sure you remember all the various values put forward for COVID-19’s R0 earlier in the pandemic – many took that as science’s flip-flopping, often with some hidden political intent. As it turns out, R0 is only a static number for those infections that have been around for a long time, like measles. For a novel disease, and that is COVID-19, the R0 will change over time as we reach equilibrium with our foe.
An R0 of less than 1 means the pandemic ends, greater than 1, and it continues, with the rapidity of spread related to increasing values over 1. We also know that the new variants seem to be more infectious, with higher R0’s.
“Rapidly evolving pathogens undergo genome sequence mutation, random drift, local selection pressure, and stochastic variation that produce genomic versions of the viral genomes that is likely associated with new infections, has been observed with the emergence of the B1.1.7 lineage and is currently fueling the 3rd outbreak wave in the UK.”
Because of the immediate worldwide concern over COVID-19 and advances in genomic sequencing, the initial virus responsible for China's outbreak is fully and widely known. This has allowed scientists to characterize the continually arising variants by how much they differ from the original. The researchers called this characterization Genome Identity, GENI, score. They also defined four phases of a pandemic surge
- An index phase with an index case and some local infections
- A “take-off” phase where there seems to be no increase in new cases, a plateau
- An exponential phase where new cases begin to rise rapidly
- A “decline” as new cases decrease
Sounds familiar, doesn’t it? The study's goal was to search for a relationship between viral change and the changing face of the pandemic.
The global pandemic is the summation of each country's pandemics, all with differing susceptible populations, geography, weather, cultural behaviors, and all finding themselves in different phases. In March 2020, only China was in decline; 52 were in the index phase, 5 in the “take-off” phase, and three exponential. And R0’s calculated for those periods varied, increasing steadily and then declining.

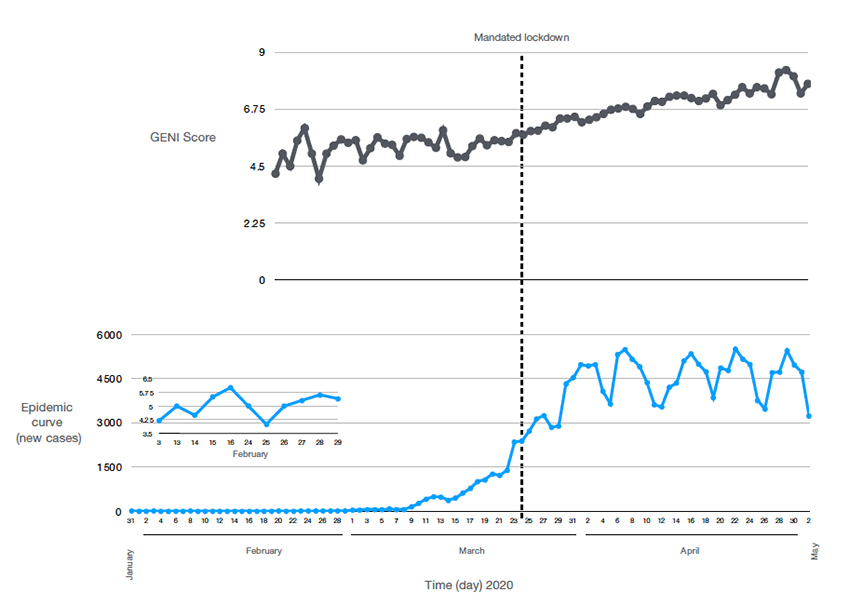
The two and 7-day serial intervals refer to the time used to calculate the R0; 7 days creates a smoother curve. Neither temperature nor population density, both factors in transmission could explain the variation in R0’s. But those GENI scores did. Here are the curves reflecting the changing variants and cases for the UK
 Notice the dotted vertical line when lock downs were mandated. The virus continued to mutate even as cases ultimately began to decline. In the words of the researchers,
“Instituting a government lockdown aimed to reduce exposure did cause variable changes in the outbreak curve it had no effect on the GENI score, which continued to rise indicating that when exposure occurred the virus was readily able to infect the person. This suggests that the underlying causes of new cases have two components—viral genome variation (evolution) and individual exposure.”
Before we hear from those objecting to any form of “lockdown,” let me be clear. The virus continues to change, irrespective of our behavior, but our behavior exposes us to new variants. Perhaps the researchers express this point more clearly in suggesting that GENI values can help monitor pandemics, so they have the last words.
“The GENI index continued to increase even when social interventions were instituted—providing evidence that multiple components of transmission are at play: (1) genome variation that increase infectivity, (2) opportunity for transmission (group gatherings), (3) specific alleles emerge that manifest in low levels (index phase) and proceed to the take-off phase when the opportunity allows.”
Source: Analysis of SARS‑CoV‑2 genomic epidemiology reveals disease transmission coupled to variant emergence and allelic variation Nature Scientific Reports DOI:10.1038/s41598-021-86265-4


