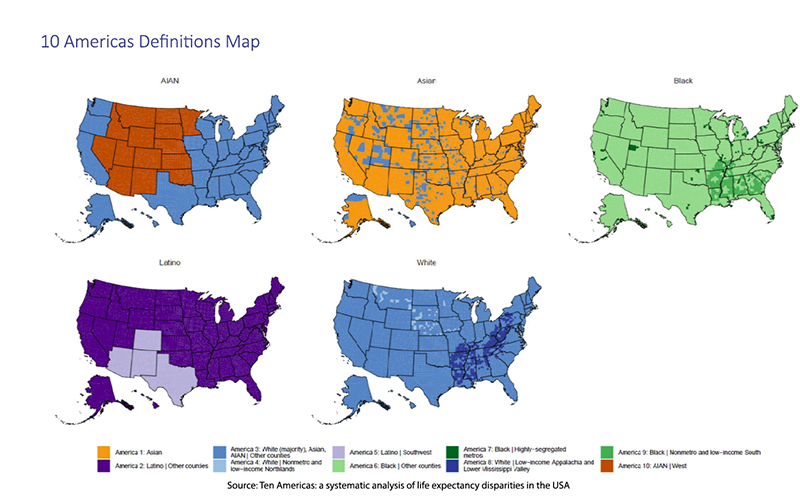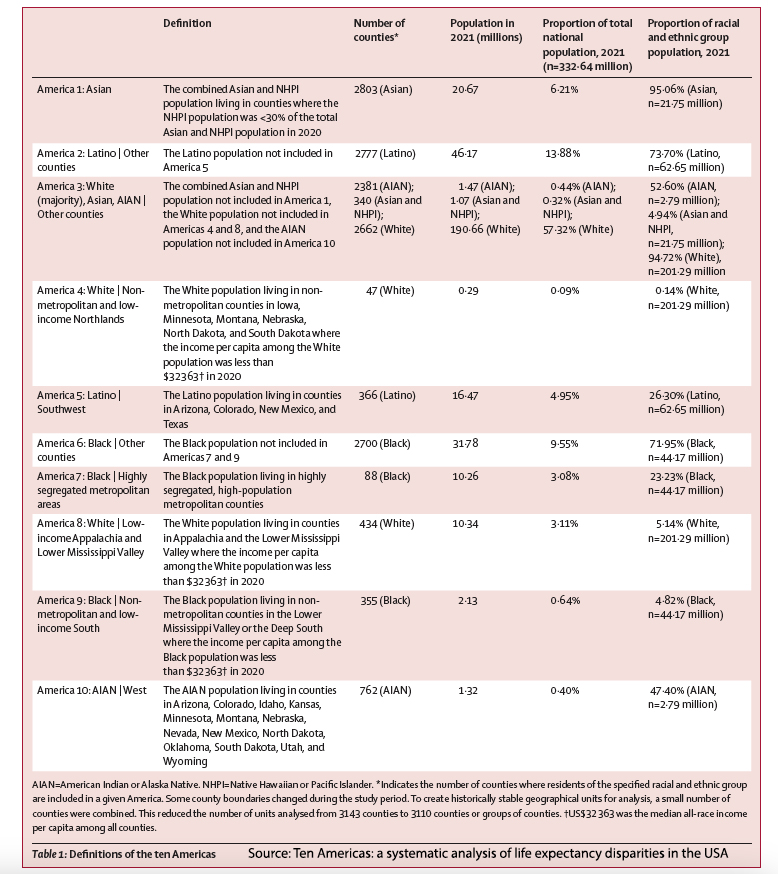
With the election in the rear-view mirror and the repercussions in the windshield, The Lancet is reporting an update on their Eight Americas study, which is now morphing to ten. Eight or ten Americas? Are we not a melting pot? I will leave that for others to consider [1]. Still, in this current study of American life expectancy, the population initially stratified into groups based on race, geographical region, urbanicity, income per capita, and homicide rates is updated a bit and now includes ten groupings. [2]
Wrapping Our Heads Around The Groupings
The researchers began defining “ten mutually exclusive and collectively exhaustive Americas comprising the entire US population,” beginning at the county level and assigning each to one of ten unique combinations (Americas). Two caveats to note: the data from the US Census and the Multiple Cause of Death Files from the National Vital Statistics System do not clearly delineate race or ethnicity – so Asian, Native Hawaiian, and Pacific Islander are clearly fuzzy, as are other categorizations leading to bias. Additionally, though we are about to talk about the ten Americas, there are, at times, significant “differences in life expectancy between counties (including counties grouped together in this analysis), even for the same racial and ethnic group.” The bottom line is that the ten Americas are inherently subjective, but they provide a lens illustrating the synergism of multiple factors over the usual simple reductive analysis.
Groupings (Numbering is based on life expectancy where 1 is longest)
-
America 10: American Indian or Alaska Native (AIAN) individuals living in the West, excluding the Pacific Coast.
- America 1: Asian and Native Hawaiian or Pacific Islander (NHPI) population in counties where NHPI individuals were less than 30% of the total Asian and NHPI population in 2020, predominantly representing the Asian population due to distinct health outcomes compared to NHPI.
- America 2: Latino populations living outside the Southwest.
- America 5: Latino populations living in the Southwest.
- America 7: Black individuals living in highly segregated, high-population metropolitan centers.
- America 9: Black individuals living in nonmetropolitan, low-income counties in the Lower Mississippi Valley or the Deep South.
-
America 6: Black populations not included in America 7 or 9.
- America 4: White populations in low-income, nonmetropolitan counties in the Northlands.
- America 8: White populations in low-income counties in Appalachia and the Lower Mississippi Valley.
- America 3: Asian and NHPI populations not included in America 1, White populations not included in America 4 or 8, and AIAN populations not included in America 10.
Recognizing that this is difficult to track I offer this visualization and as well as a table [3]. For our purposes, it may be sufficient just to acknowledge that not only are there racial categorizations but, within those racial groups, further stratification by income and geographic locale.

Life Expectancy
Finally, just to be sure we all are on the same page, life expectancy is an estimation of when you might die based on a specific age, in this instance, year of birth. It can be calculated in several ways, often using life tables for particular age groups. It is just one health measure and is a rough aggregate of many factors. It is very sensitive, susceptible to early deaths in childhood, adolescence, or young adulthood, dropping in the face of our epidemic of overdoses and gun deaths, and less sensitive to deaths in the elderly.
The life expectancies are based on the Multiple Cause of Death Files from the National Vital Statistics System, which were then tabulated and adjusted at the county level “with population estimates by year, county, age, sex, and race and ethnicity.” Each county was assigned one of the 10 Americas, and mortality rates generated. The results involve lots of Mathmagic but focus on the big picture; there are no p-values to concern ourselves with, just the gist.
Results
Across the decades from 2000 to 2022, life expectancy varied widely across the Americas. Asians (America 1) had the longest life expectancy while the AIAN individuals in the West (America 10) fought it out with the three Black Americas (6,7 and 9) in the race to the bottom, the lowest life expectancy. Overall, the disparity between the top and bottom grew from 12.6 years to 20.4 years.
Between 2000 and 2010, life expectancy for all groups, except for AIAN individuals, grew longer. AIAN's life expectancy declined by a year. Between 2010 and 2019, life expectancy trends showed more modest changes. The widening disparity between top and bottom was again driven by another loss in a year of life expectancy by AIAN individuals. There were small gains and losses in the other groups of two to eight months.
Life expectancy dropped significantly across all groups during the first year of the COVID-19 pandemic, with dramatic variation. The gap between the highest and lowest continued to widen due to the steepest drop experienced by the AIAN individuals, -5.3 years. Black Americans in our segregated metropolitan areas fell by 4.1 years, and Latino populations lost 3.9 years. White individuals in Appalachia and the Lower Mississippi Valley fell by 2 years, while White-dominated Americas 3 and 4 lost only 1.4 years. Later in the pandemic, after vaccines became widely available and mandates were enacted but not necessarily followed, there were slight rebounds among Blacks living in segregated metropolitan areas, Asians and Latinos and continued declines for AIAN in the West and among White Americans in Appalachia and the Lower Mississippi Valley.
Dividing these categorizations by race, geography, and income we see that each considered separately is a poor predictor of outcome. Whites in America 3 lost 0.3 years over the decades, those in low-income Appalachia lost 3.7 years, and their low-income brethren in the Northlands 0.9 years. Similarly, for Blacks, there were gains in highly segregated metropolitan areas of 0.9 years, a 0.3-year gain in less segregated “Other” counties, and a loss of 2 years for those Blacks in the low-income South.
“These disparities reflect the unequal and unjust distribution of resources and opportunities and have profound consequences for the wellbeing and longevity of marginalised populations.”
Clearly, there are inequities for AIAN individuals. We can see similar inequities if we look at CDC data on those initially vaccinated for COVID-19. The disparity in vaccination was greatest in the Midwest and South (24 and 20% less) than in the North or West (12.6 and 12.1% less) than for Whites (used as the reference population). When AIAN individuals were stratified by urbanicity, a measure of population density, those in rural areas were vaccinated at essentially the same rates as rural Whites. In contrast, those in the metropolitan areas were 21% less vaccinated.
And as it turns out, we are all marginalized. The researchers write, “This study highlights inequalities among White Americans by geographical location and income level,” pointing to the disparities among White Americans, specifically,
“the gap in life expectancy between America 8 and America 4—both White and lower income—grew from 2.8 years in 2000 to 3.8 years in 2019, and to 5.6 years in 2021.”
Reductive investigations involving limited variables are models and, like all models, are poorly reflective of reality. Moreover, the solutions that fit models are poorly adapted to alter our realities. The inequities in our health cannot be simply stratified and categorized by race, income, education, or location. The Ten Americas study lays bare their deep entanglements in shaping our health and longevity. Those factors, by themselves, are a pale proxy for what might be a more significant driver, culture, or habits we learned from kith and kin, which are only hinted at by race, education, income, or location. Yet, while the researchers gesture toward solutions rooted in income and education, if we want to close the ever-widening gap in life expectancy, we’ll need more than reductive models—we’ll need an honst reckoning with the messy, interconnected realities that define what it means to live, and die, in America.
[1] For those who wish to look at America through a far more ethnocultural lens, let me enthusiastically suggest American Nations: A History of the Eleven Rival Regional Cultures of North America by Colin Woodard, a historian who identifies eleven distinct nations with their own historical roots. Written in 2010, he provides an alternative interpretation of our history and how the conflicts between these ethnocultures have defined and continue to define America. Spoiler alert: while written over a decade ago, it will provide both sides of the aisle with a different read on the recent election.
[2] In the original study, high-risk living environments were captured by homicide rates, but in the current study, segregation, a county with a Black to White dissimilarity of 60 or higher, was used. Low income was considered a median country income per capita of less than $32,363 for all groups.
[3] 
Source: Ten Americas: a systematic analysis of life expectancy disparities in the USA The Lancet DOI: 10.1016/S0140-6736(24)01495-8


