Polluted air can acutely affect public health, whether from fires, disasters, or stagnant weather conditions. Such effects are often characterized as premature mortality in terms of body counts, as are accidents and house fires. For example, about 4,000 people died over several days during the Great London Fog of 1952 (~14 times normal), shocking the world.[1]
For comparison, I considered the first US urban air pollution episode garnering public attention in November 1953 in New York City, during which significant excess mortality occurred in all age groups.
“Telephone calls from city residents reporting eye irritation and coughing flooded the office of the department.”
This event resulted from a stagnant high-pressure weather system that trapped the city’s emissions of combustion products and was perhaps the worst in recent history. Air monitoring systems were in place, and relevant data were recorded and published, which I revisited. Statistically, the high daily death counts in NYC compensated for the brief study period and allowed age groups to be considered.
What is seldom recognized in studies of air pollution and excess daily mortality is that different people are affected on each day of an episode (you can only die once). On a given bad-air day, the frail and most susceptible individuals are likely to succumb first, followed by others on succeeding days. When polluted air persists as it did in London and New York, this process repeats until the air clears. The frail subpopulation is exhausted, to be replenished as the underlying population ages. The appropriate mortality metric is not the percentage increase on the worst day of the event but the sum of excess deaths over the entire event.
As noted since the 16th century, "the dose makes the poison,” and doses of air pollutants increase continuously during a persistent episode. Those who died on the second day of such an event would have received about twice the initial dose, and the correct relationships are thus time-dependent. Most of the excess deaths reported in published daily mortality studies may be underestimates of such events.
The 1953 NYC episode
The published data from this event comprise daily wind speed and SO2 values for 1953 and death counts and measures of total suspended particles (TSP) for 1950-1956. The New York City Department of Air Pollution Control concluded that mortality from all ages increased significantly during this period. I plotted the daily death counts, expressed as the percent difference, “excess deaths,” between 1953 and 1951, and the averages of 1952, 1954, and 1955.
The data are generally consistent: calm winds increased “equivalent TSP” [2], and SO2 and mortality increased several days later. There is no evidence that mortality decreased inordinately after the episode due to the premature “harvesting” of frail individuals whose lives may have been shortened by only a few days. I found no evidence for either weekend or holiday effects on 1953 mortality.
Effects on public health as percentages of annual deaths.
I analyzed the New York episode by comparing 1953 daily deaths with the averages of 1952 and 1954 to define daily “excess” deaths and summed them over November based on 7-day periods.

In 1953, this running sum reached about 0.3% of annual deaths, while differences between 1952 and 1954 oscillated around zero with no build-up. The next question is the relationship between excess deaths and environmental conditions – the dose-response function.
Calm wind conditions elevated the concentrations of both SO2 and TSP. To estimate a dose-response relationship for TSP, I regressed the 7-d mortality increase as a percentage of annual mortality and found a highly significant relationship.

Based on that relationship, I would attribute < 0.1% of annual New York City mortality to recent Canadian wildfire smoke exposure. Exposures to “equivalent TSP” levels as high as 170 μg/m3 were reported during the 2002 Canadian wildfires, with no excess deaths reported.
Wildfires vs. Urban Smog
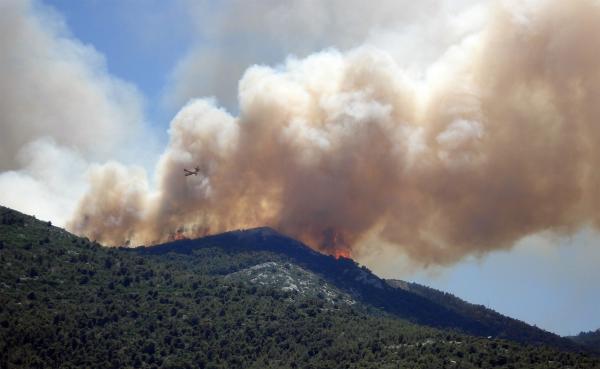
There are significant differences that help explain the low mortality from exposure to wildfire smoke. The EPA lumps together all particles of a given size regardless of chemical composition, but wildfire smoke is basically limited to carbon compounds, while urban smoke is likely to include sulfur, metals, vehicle road, and brake-pad dust. Differences in exposure are likely to be even more critical; urban smoke concentrations tend to be similar throughout a city on a stagnant air day, with little escape. By contrast, wildfire smoke travels with the wind, its distinctive odor identifies relatively safe locations, and multiday exposures to toxic levels are unlikely. Residential air conditioning can significantly reduce exposure to outdoor air and is now ubiquitous in large cities.
There have been many horrendous consequences of this season’s wildfires, but deaths from prolonged smoke inhalation are not among them.
[1] Lipfert, FW. Air Pollution and Community Health. Wiley. 1994 ISBN-13. 978-0471285601
[2] At that time, airborne particulate matter in NYC was based on filter staining referred to as “smoke shade,” for which I developed a statistical relationship with conventional gravitational measurements of total suspended particulate matter that I designated “equivalent TSP.”


