The media consistently paints a simplistic picture of climate change: stop burning fossil fuels that emit CO2, and the planet will stop heating. However, the current CO2 reductions have had little effect on global temperatures.
Factors
Atmospheric “greenhouse” gases that trap heat have long been known:
- Carbon dioxide (CO2) produced from burning carbon-based fuels is the most abundant and has become a reference standard.
- Methane (CH4) occurs naturally and is the main component of the gas that heats our homes and cooks our food.
- Nitrous oxide (N2O), “laughing gas,” is much less abundant.
- Black carbon (BC) is a particulate resulting from incomplete combustion, as may be the case with diesel engines and wildfires. BC is a known constituent of urban air pollution but has not been regulated.
- Chlorofluorocarbons (CFCs) and other synthetic gases used in refrigeration, air conditioning, and aerosols, whose production has been mostly phased out.
“El Nino,” a periodic warming of sea surface temperatures in the central and eastern tropical Pacific Ocean, is a climatologic factor affecting short-term warming.
On the other side of the ledger, sulfur dioxide (SO2) emitted by volcanoes and produced by burning coal or heavy fuel oils can cool the atmospheric greenhouse. It oxidizes in the atmosphere to form shiny sulfate particles that can reflect solar energy. The major volcanic eruption of Mount Pinatubo in 1991 is thought to have cooled the atmosphere by 0.5oC, spawning so-called geo-engineering projects to inject SO2 into the atmosphere for this purpose.
Citizen Science
Concerns about global warming, now called “climate change,” have focused on how bad it is likely to get and what can be done to slow it down. Rather than assigning blame, let's estimate, using regression analysis, the relative contribution to temperature change of known agents, singly and in combination. I focus on CO2, CH4, BC, SO2, and El Nino years. The concentration of N2O has been essentially constant and was not considered, and we lacked data on CFCs. I used Gross Domestic Product (GDP) as a measure of all economic activity and thus a proxy for CO2 and other atmospheric parameters. The data come from various sources, and I used linear interpolation to assign missing data points and linear extrapolation to estimate future data points.
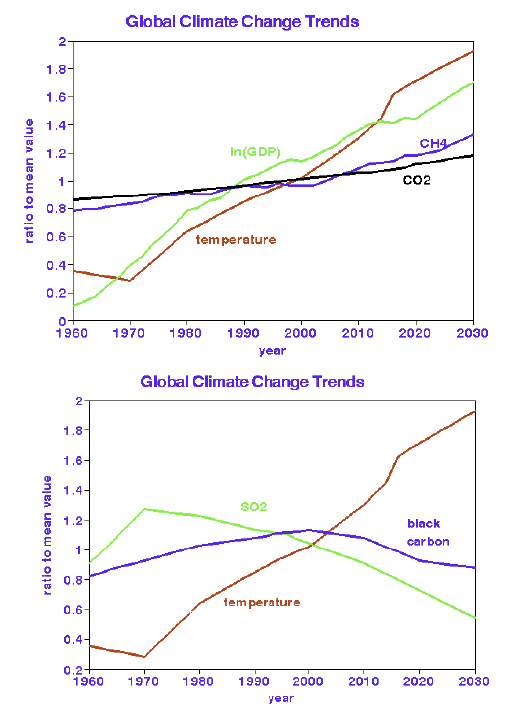
Because of the wide range of values, I “standardized” their visual representation as ratios compared to their individual means.
The log of GDP, a measure of human activity, tracks very closely with rising temperatures as do the trends for CO2 and CH4. Trends of the air pollutants SO2 and BC differ and are depicted in the second graph. Their diminishing levels reflect the various regulatory efforts to reduce their associated adverse health effects.
Statistical Relationships
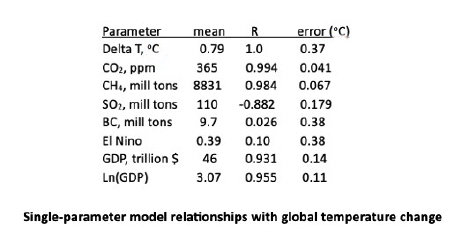 This table quantifies the “strength” of each component in changing temperature when each is considered to act by itself. Because the statistically derived values are so similar, the mean prediction error must be considered in their comparison.
GDP, CO2, CH4, and SO2 each have significant statistical power to predict the annual change in global average temperature with reduced prediction error. CO2 produced the least error. Black carbon and El Nino have little “explanatory” power in predicting global trends, notwithstanding their physiological relationships.
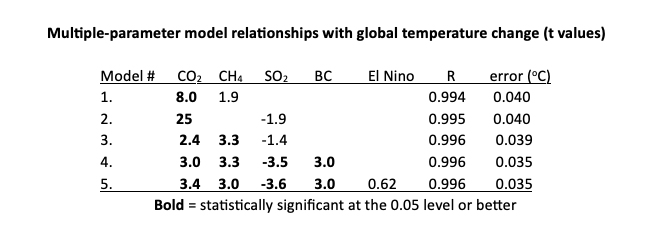 This table shows what happens when our modeling allows these parameters to interact. These models have essentially the same overall correlation but convey different messages. They confirm the warming effects of CO2, CH4, and BC and the cooling effect of SO2, dismiss any excess warming effects during El Nino years, and reduce the prediction error by 10-fold. [1] These findings confirm the conventional wisdom of the causes of global warming and provide confidence in our estimated effects of these parameters on the magnitudes of temperature changes.
Finally, when I listed the estimated contributions of each parameter to temperature change over time, I found that while their contributions changed, their sums matched the actual temperatures reasonably well.
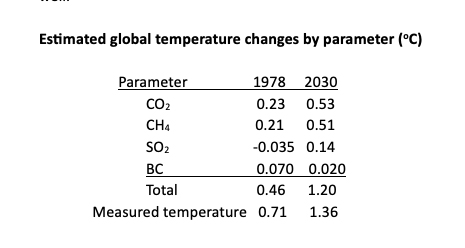
The most important finding from this simplistic analysis is the similar contributions of CO2 and CH4, which require very different emission control strategies. CO2 is an inevitable product of urban and rural life, while urban CH4 is primarily a waste stream resulting from natural gas leakage and flaring during oil production. Controlling CO2 can be expensive, while controllingCH4 should be cost-effective. Contributions of black carbon (also known as smoke or elemental carbon) are minimal, but BC emission controls could also improve public health. By contrast, the draconian SO2 emission controls imposed in the 1980s and 1990s must be considered counter-productive.
While this analysis demands more detailed replication, the bottom line is that climate change policy needs more “Diversity, Equity, and Inclusion.”
[1] For comparison, the log of GDP produced a t value of 15 and a correlation coefficient of 0.93 as a single predictor. Atmospheric analyses rarely achieve such near-perfect correlations, especially when using data from various sources.