Race and ethnicity remain sociocultural constructs fabricated by our beliefs rather than clear scientific information. Despite that, as I have written, there remains some value in population-level health analysis in retaining those sociocultural constructs. A new study in the Annals of Internal Medicine makes my point.
The data comes from the National Vital Statistics System – our national registry of death certificates, identifying who is dead amongst us. In 1997, the Office of Management and Budget (OMB) broke up the racial category of Asian or Pacific Islander, creating Native Hawaiian or Pacific Islander (NHPI) and Asian. (Asian could do with a further separation, but we will leave that aside for the moment). Here is what they found:
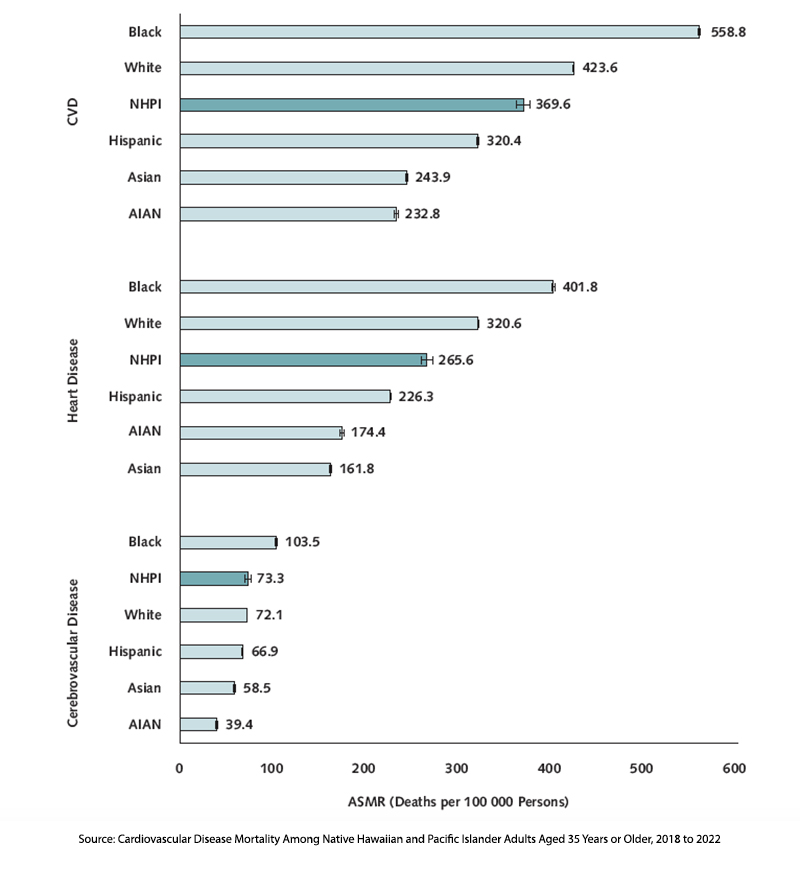
Between 2018 and 2022, there were 4.5 million deaths attributable to cardiovascular disease in adults aged 35 or older.
- A higher proportion of NHPI adults were aged 35 to 64 at their death (37.1% vs. 16.9%).
- The Age Standardized Mortality Rate (ASMR) for NHPI adults was 369.6/100,000, making it the third highest after adult Blacks and Caucasians. It was 50% higher than for Asian adults at 243.9/100,000.
- NHPI adults had greater ASMRs from heart disease than Asians, 265.5 vs 161.8
- NHPI adults had greater ASMRs from cerebrovascular disease than Asians, 73.3 vs. 58.5
It should be clear at this point that from a population health perspective, NHPI individuals currently have very different cardiovascular outcomes than “Asians” and that this differentiation was lost in the previous categorization. Aggregation frequently simplifies, but simplification may not give us the most impactful view or analysis, especially when we use this information to inform 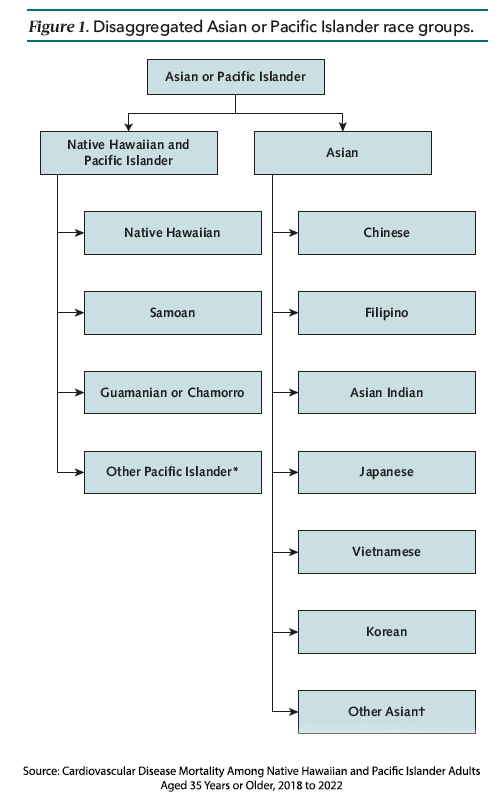 policy and funding.
On the other hand, separation may result in a too-fine selection, reducing the size of the sample and its statistical meaning (power). As the graphic shows, the categorization of Asians contains multitudes, and those asterisks lead to even more Pacific Islanders and Other Asians. [1]
Knowing when to aggregate and separate is often more art than science. To make matters more complicated, those choices can change over time and geography. For example, California and Hawaii accounted for nearly two-thirds of NHPI individuals, and Arkansas only 1%. According to the University of Hawaii Economic Research Organization (UHERO), Nevada and North Carolina are new homes for NHPI internal migration.
“You cannot have health equity without data equity.”
- Ninez A. Ponce PhD, Director, UCLA Center for Health Policy Research
Of course, that is harder to achieve than to say. The problem is made harder when our political beliefs color our thinking and we ascribe explicit or implicit intentionality to the choices to aggregate or separate. How we categorize our data can make a difference, and thoughtful consideration is warranted by the researchers and those reading their work.
[1] You can find more on the aggregation-separation dilemma of Asian Americans in this STAT article.
Source: Cardiovascular Disease Mortality Among Native Hawaiian and Pacific Islander Adults Aged 35 Years or Older, 2018 to 2022 Annals of Internal Medicine DOI: 10.7326/M24-0801

Chuck Dinerstein, MD, MBA
Director of Medicine
Dr. Charles Dinerstein, M.D., MBA, FACS is Director of Medicine at the American Council on Science and Health. He has over 25 years of experience as a vascular surgeon.