Let's pretend that you're a dishonest scientist who wants to fabricate some data for an experiment. Let's further assume that you run an experiment five times and want the average answer to be "10".
You might fabricate your data like this to get your desired result: 9.75, 9.5, 10.25, 10.5, 10. This, indeed, produces an average of 10. But so does a result like this: 8, 12, 9, 11, 10. If somebody suspected that you fabricated your data, how would they know?
In some cases, if the data "look too good to be true," they just might be. Notice in the first data set that the numbers are very "tight" around the number 10. In other words, each number in that data set doesn't deviate much from the average, a concept known as the standard deviation. For that first data set, the standard deviation is 0.395. The second data set, which looks more realistic, has a standard deviation of 1.58.
This simple test for fraud is far from a "slam dunk." Depending on the nature of the experiment, it might raise a red flag and warrant further investigation or it may not. Besides, a smart con artist is probably too sophisticated to fabricate data that looks too good to be true. Thankfully, there are other more clever ways to detect possible fraud.
 Benford's Law: Which Countries Might Be Lying About COVID Cases?
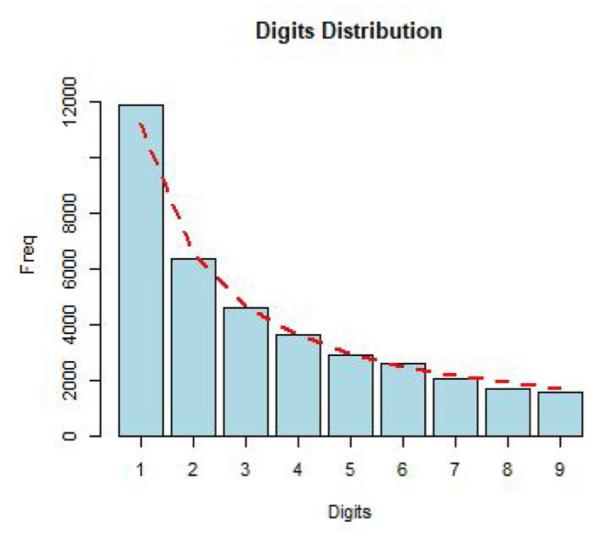
Real-world data sets follow a very strange pattern known as Benford's Law. The law describes how the first digit of each number in a random collection of numbers is most likely to be 1, that the second most likely is 2, that the third most likely is 3, and so on. As odd as that sounds, it has been shown to be true in everything from accounting to physical constants.
And it has been shown to be true for the number of COVID cases reported around the world. (See figure.) In the Journal of Public Health, researchers Ahmad Kilani and Georgios Georgiou show that globally reported COVID case numbers follow Benford's Law, which suggests that, taken as a whole, the COVID case counts are legitimate.
But that wasn't the case for individual countries. Some countries violated this pattern, which hints that the number of COVID cases reported there could be fabricated or misreported. They found that the following countries had suspicious data:
Belarus
Tajikistan
Russia
Ukraine
Uzbekistan
Argentina
Brazil
Chile
Colombia
Honduras
Mexico
Nicaragua
Panama
Peru
Bahrain
Egypt
Kuwait
Palestine
Saudi Arabia
Qatar
Syria
Albania
North Macedonia
Poland
Bangladesh
Bhutan
Cambodia
Mongolia
India
Iran
Pakistan
Philippines
Turkey
Liechtenstein
Taiwan
United States
Overall, the authors found that suspicious data were most likely associated with less developed countries. The final three in the list are in bold because, in contrast to the others, they are fully developed countries. In an email to ACSH, Dr. Kilani said that Liechtenstein and Taiwan had extremely small sample sizes, while the U.S. had an extremely large one. This might skew the test results.
Are COVID Case Numbers in the U.S. Fabricated?
It should be reiterated that a violation of statistical expectations such as Benford's Law does not prove malfeasance. It simply suggests that something might be wrong and is worth a closer look. The fact that the U.S. is among those with fishy data may require some investigation.
Source: A Kilani, G P Georgiou. "Countries with potential data misreport based on Benford’s law." Journal of Public Health. Published: 27 January 2021. DOI: 10.1093/pubmed/fdab001


