The media usually report COVID data regarding recent changes in daily cases and deaths (typically single-digit percentages) or cumulative counts for the U.S. or globally (typically millions). Neither provides a gut feeling as to the seriousness of the pandemic. We used state-level data from public sources and searched for relationships that could explain differences in life expectancies among states.
Life expectancy
Life expectancy represents the average life span of a newborn if the current death rate remains stable. Life expectancy can illustrate the overall health of a population and is based on observed mortality rates by age [1]. As you might expect, these mortality rates nearly double each decade from ages 35 to 75. Deaths increased by about 15% per year during the pandemic, corresponding to a shortening of life by about two years, more than is attributable to ischemic heart disease, our “biggest” killer.
Fifteen percent of the nearly 7.5 million all-cause deaths occurring since the pandemic's beginning amounts to 1.1 million deaths and corresponds nicely with the current COVID-19 death count (1.06 million). This represents an economic loss of about $220 billion. [2]
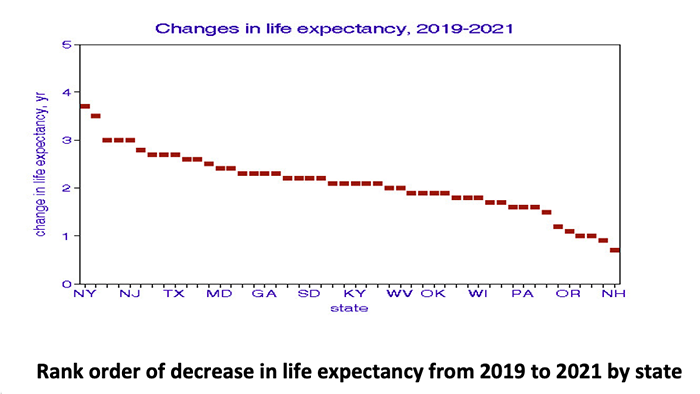
Life expectancy differs among the States.

The greatest loss was in New York State, which suffered greatly during the early days of the pandemic. The lowest losses are in New Hampshire. This analysis of changes in life expectancy associated with the pandemic does not address causes of death; assigning them solely to COVID is an assumption. It is possible that some of the deaths during the pandemic resulted from comorbidity and were merely accelerated by COVID.
The Role of Our Behavior
Using regressions, we checked for relationships associated with COVID mortality. Political affiliation, household income, and use of face masks (as a measure of “individual protection” were not associated with any changes in life expectancy. However, booster vaccination coverage was an entirely different story.

Without booster coverage, we can anticipate a 3-year loss in life expectancy. Immunologic protection of 65% of the population would reduce that additional loss of life expectancy to zero.
While others have reported significant relationships between life expectancy and reduced air pollution, we found no relationships between changes in life expectancy and statewide mean concentrations of fine particle mass, black carbon content, sulfate and sulfur dioxide, or nitrogen dioxide. However, we did note a weak relationship between life expectancy and reduction in fine particles, PM2.5. Contrary to expectations of the common narrative, states with improved ambient air quality had larger losses in life expectancy during the pandemic.
I am left to conclude that continuing vaccination, now with “boosters,” has the potential to increase our life expectancy. This conclusion is nowhere to be found on the Internet’s reporting on COVID-19.
[1] Such rates are expressed as deaths as a fraction of the population.
[2] Based on a calculation of $100,000 in economic value per person-year. Other estimates of the “value” of a statistical life are much higher.


